I’m sure you’ve heard the saying “mix with your ears, never your eyes…”
Well, we’re here to completely break down those old-school stereotypes and welcome you to the world of modern production.
» Mixing with your ears only provides you with half the accuracy. When learning how to analyze music, both senses are key!
It could even end up putting you at a disadvantage…
When you submit your music to any digital platform, it’s not a human analyzing each track, it’s a statistical algorithm.
Values 一 with a heavy emphasis on the average volume level (overtime) 一 are the only things that truly matter.
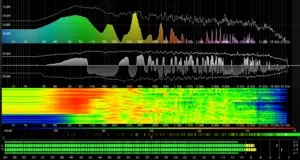
4 types of visual audio analyzation
If you don’t set up your music beforehand to match their standards, they’ll end up applying their own dynamic-processing algorithms (aka their own form of predetermined mastering).
This could, in turn, completely ruin your music… not to mention, break your heart. Music is your art, and you should never ever let the algorithms hold your paintbrush!
You should never ONLY mix with your eyes, but you should never ONLY mix with just your ears either.
Here’s how to analyze and produce the perfect mix using both:
Table of Contents
1. VISUAL WAVEFORM ANALYSIS
By analyzing what a particular waveform looks like you can see what’s essentially the ‘outer shell’ of the audio at hand.
» This is the easiest, quickest, and most accurate way to visually see the structure of a sound.
This kind of analysis allows you to scope out the overall Volume Envelope structure and harmonic content of a signal. As well as the volume levels, contours, and detect potential clipping issues (amongst other things).
Once you know what you’re looking at, you’ll even be able to analyze the tempo of any given rhythmic-based track using one of the following techniques as well.
Start paying attention to these ‘blobs.’ They are more useful than they appear. Blobs are visual representations seen in a DAW or program when looking at and making up each and every file.
You can’t determine frequency content by looking at said blobs in default form.
If you use a DAW such as Reaper (which is based on harmonic content using spectral analysis) you may be able to have your DAW designate a specific color to the waveform that varies based on the frequency content of a given track.
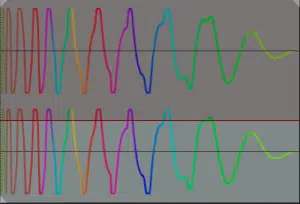
Above, you can clearly see a less-than-one-second sample, which makes it easy to determine it’s a one-shot.
But is there a way to get any more specific and precise about what type of one-shot?… Absolutely!
If you’ve spent years looking and analyzing audio files within your DAW, guessing with accuracy is pretty much second nature.
» If you’re first starting out, or have never listened with your eyes before: analyzing and determining which specific type of one-shot has a Volume Envelope that matches the one you’re looking at is key.
BREAKING DOWN THE VISUAL INDICATORS:
1. A KICK
- Attack 一 almost instantaneous
- Release 一 quick and concise, yet not quite ‘abrupt’

This is distinguishable from something like an 808 simply because of the length of its Envelope. A typical kick will never sustain for this long or have such a long attack.
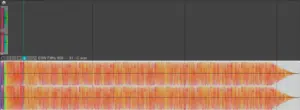
2. A SNARE
Unlike the other drum elements, a snare’s envelope pretty much stays consistent throughout the course of its duration.
- Attack 一 instantaneous
- Release 一 anywhere from almost instantaneous (particularly with no processing applied) to a short fade with a somewhat abrupt tail.
Other times, the release/tail may be somewhat extended, with a length highly dependent on whether or not any post-processing has been applied.
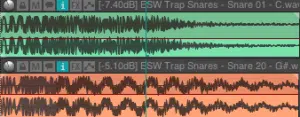
Above, you can see an example of a snare with a ‘reverb’ tail (top/green) and one with an abrupt end (bottom/orange), yet both are the same exact length.
A clap (below) looks very similar and, unless there is reverb applied, will almost always have a (somewhat) abrupt end.
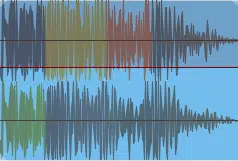
Similar to other drum samples, sometimes it will appear to be clipped, and it very well may be because clipping was probably applied on purpose.
However, in the cases where clipping was not applied intentionally, visual analysis is a great tool to help you determine these (potentially) problematic samples.
» Just because you purchased your samples from reputable sources does not mean it was processed correctly!
To hear examples of what it should sound (and look) like, download the FREE Unison Artist Series Essentials. They are always perfectly mixed and you can always safely plug & play them in your music without hesitation.
3. CLOSED HI-HAT
Visually speaking, the hi-hat’s Envelope will typically have:
- Attack 一 slight
- Release 一 short; with a longer release tail than the attack
- Sometimes 一 you’ll find they are of equal proportion
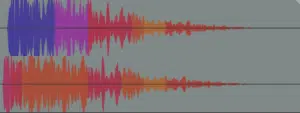
Granted, it’s certainly subtle, but when comparing its attack to that of, let’s say, a kick or snare, it’s much more pronounced.
When you’re learning how to analyze music, especially in the visual sense, subtleties are what you need to be relying on.
4. OPEN HI-HAT & CYMBAL
The open hi-hat and cymbal are not difficult to discern at all, once you’ve seen them a couple of times.
- Attack 一 can vary between instantaneous and a slight-to-medium lead in Attack time
- Release 一 long to extremely long
They typically appear very similar to one another, except for the fact that a cymbal is usually longer with an extended Delay and Sustain portion (shown below).
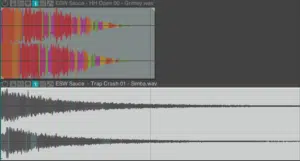
5. DISTORTED AUDIO/MIX
Regardless of the file at hand, clipping always looks the same 一 the blobs are so big that its level exceeds the clip; appearing to be cut off.
It tends to look fairly boxy which, in turn, makes it very difficult (almost impossible) to determine whether it was processed intentionally with some form of distortion/clipping or a real processing error.
This is when you’re going to need to trust your ears and try your best to make an accurate distinction.
One way to discern that it was intentional, is the context of its sound and the fact that the distortion adds something sonically beneficial; it doesn’t destroy the signal as the example above it.
![]()
» Above, you can clearly indicate clipping.

» Here is the same audio file, minus any clipping.
The dead giveaway, however, without even hearing it, is the fact that the level doesn’t max out at 0.
Although there is clipping applied, you still have headroom available, which usually indicates it was intentional. Use your ears to confirm it.
NOTE: When you introduce a signal that exceeds 0dB before being bounced, it will no longer exceed 0dB in any format; it will clip instead.
This is a prime example of how to check/test the viability of your tracks and mixes, as well as the audio and samples you plan on using.
Keep in mind that if it’s clipped unintentionally or you don’t absolutely need to incorporate it, don’t. Simply find an alternative.
Worst case scenario you can use a program like Izotope RX’s De-Clipper to minimize clipping and remove some of the destruction it caused… but you’ll never get it quite as perfect.
6. TEMPO OF A MIX
Determining the tempo of any mix visually depends on the track at hand, how ‘busy’ it is (in terms of non-rhythmic elements), and its (visual) rhythmic definition.
When looking at something like a mixed/mastered Hip-Hop, EDM, or Pop song (along with percussion and drum loops) you can calculate the estimated BPM of the audio. With the help of your DAW’s grid, of course.
You’re looking specifically for beats, typically of the drum and/or percussive variety, because they are more consistent and, of course, defined rhythmically.
Since it typically doesn’t change throughout the track, it can most accurately help you to figure out the tempo. Even if the drum/percussive elements do change at some point (or even continuously), it’s only the drum-type or even drum pattern that gets affected.
The time/beat structure will still remain the same 一 hence, the tempo remains the same.
ALL YOU NEED TO DO IS:
- Load up your track (visually).
- Inspect and define its rhythm.
- Using the grid, change the BPM Value until your beats are aligned.
I suggest separating an estimated 4-8 bars of the track, if it’s not a simple loop, and going from there.
Once you have the general beats visualized, feel free to create markers, or make splits based on transients (ideally) for accuracy in order to see it visually aligned with the audio.
» Simply pick a starting tempo, and shift it until the grid (roughly) aligns with the percussive/rhythmic elements of the file’s pattern.
Now you’re well on your way to getting an accurate BPM, all without even having to hear the results. Let your eyes guide you!
Don’t go too crazy trying to match it within a decimal of the tempo, because that’s a lost cause. Besides, most of the time it’s a whole number anyway.
Let’s be honest… what are the chances of you settling for a tempo of (for example) 95.3? Slim-to-none, right?
» Just make sure it roughly aligns with the file’s pattern, and you’re good to go (shown below).
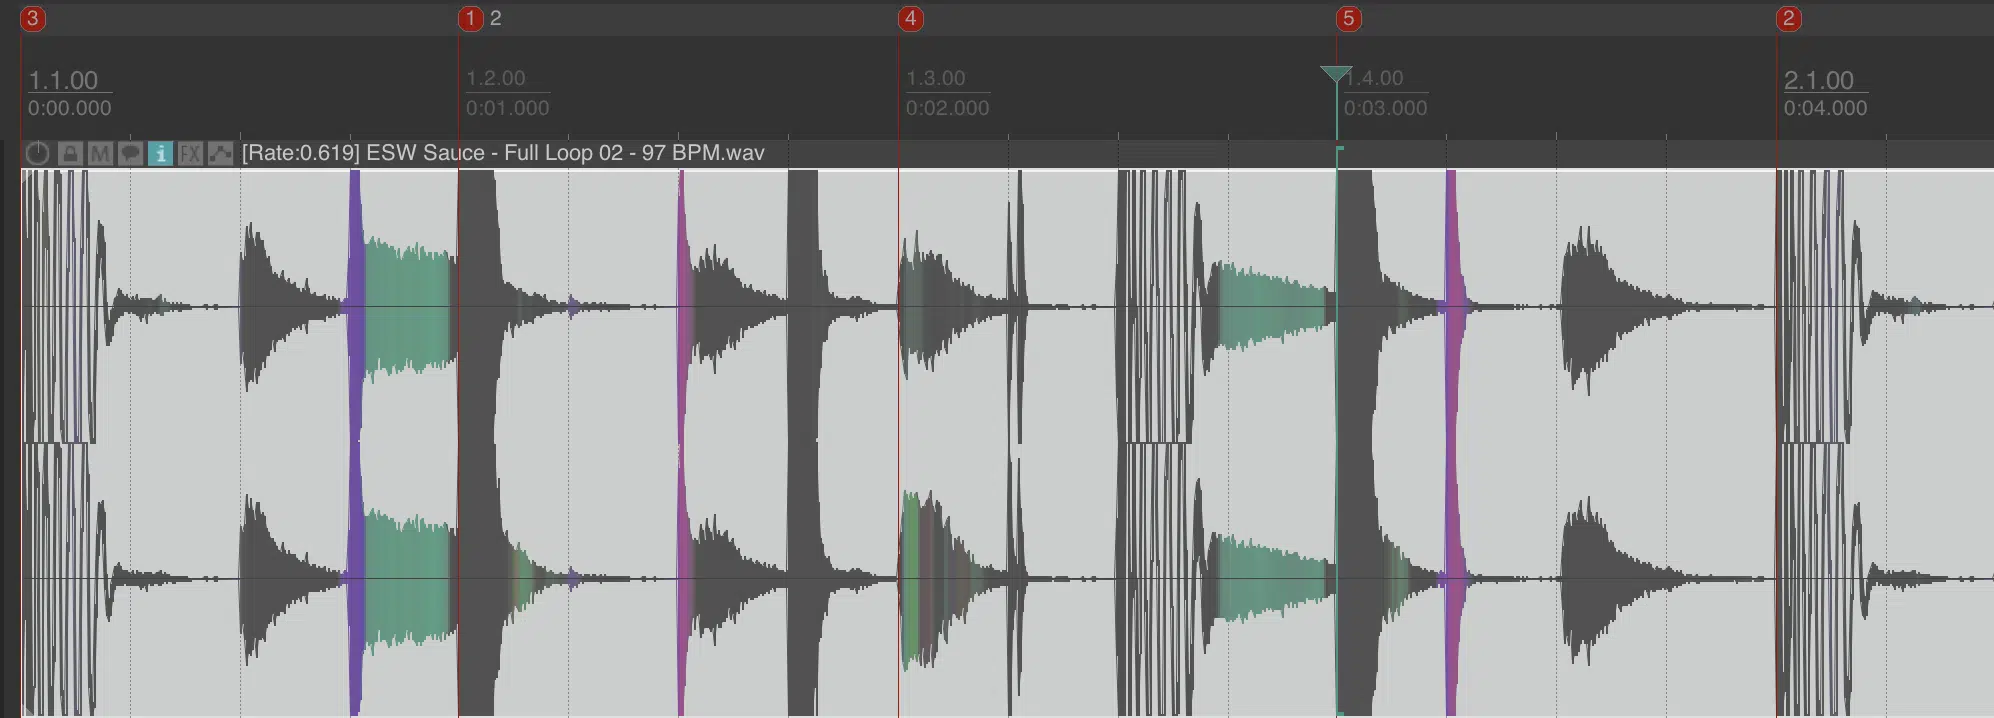
It always helps to use a grid size with a relatively high-value 一 such as 1/8th to 1/16th.
This way, you have more than just a few lines to align the kick and snare with. This will help with accuracy.
You can also align the hi-hats if they’re defined well enough. If not, either the kick or snare is all you need, but both are preferable.
» To double-check the BPM Value, Tap Tempo is always a good backup (or even a good starting point).
2. SPECTRUM ANALYSIS
Spectrum Analysis is, hands down, the most accurate way of analyzing a track’s harmonic content. It will provide you with the biggest clues about what the audio will actually sound like.
Certain elements can have the same envelope structure and even the exact same average volume level, yet sound nothing alike.
To better visualize this: think of when you hear a commercial on TV that is obnoxiously loud…
Its volume is not technically louder than the commercial before it (in terms of dBs) in the algorithm’s eye 一 as it blindly applied dynamic-processing 一 but it can’t account for the human auditory system.
With the help of Spectrum Analyzer you’re able to determine (or get an idea about) which type of instrument you’re hearing/seeing. As well as whether or not the audio is actually a certain element; such as the indistinguishable harmonic footprint of a vocal.
A SPECTRUM ANALYZER: a measurement tool that displays real-time frequency analysis of incoming signals. It is a specialized type of sound-level meter that allows you to examine the amplitude vs. the frequency spectrum of a sound.
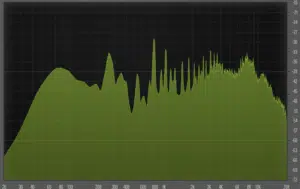
- » The horizontal axis 一 shows frequency & pitch, measured in Hertz (Hz).
- » The vertical axis 一 shows the amplitude of those frequencies, measured in decibels (dBs).
Using a spectrum analyzer in conjunction with other available analyzers will paint you a trustworthy picture of the audio you’re analyzing.
Knowingly or not, you (most likely) use a form of spectral analysis daily, as Parametric EQs have them built-in… but how often do you actually rely on them? If not very, it’s time to change that.
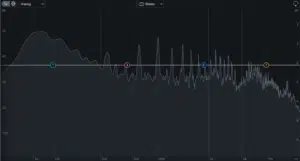
Whether it’s due to lack of experience, ear fatigue, situational or systematic issues (the room you’re in, the speakers you use), or what have you, there are always factors you’re unaware of or can’t hear.
» Therefore, making spectrum analysis part of your regular workflow routine is a must!
NOTE: They are also very beneficial when it comes to recognizing frequency build-up, masking, and phase issues. Whether it is on a single track (like your master), or in between tracks/groups of tracks.
Some of the more advanced EQs and Spectrum Analyzers let you load the plugin across the entire mix, and have it analyze any potential issues for you (such as Voxango’s SPAN Plus & many of Izotope’s processors).
3. PEAK METERING & LUFS
While these meters and their given results may not matter most in the overall timbre and shape of a sound, it’s the only type used to algorithmically analyze your track upon submission of any type.
It will determine if, and how much processing needs to or should be applied upon upload, acceptance, and release of a specified platform.
» It’s important to familiarize yourself with each platform’s standards 一 like Spotify for example.
Even if you don’t have a perfectly mixed/mastered track, it’s best to follow the guidelines and prevent the need to constantly change it.
Or, even worse, have them dynamically alter it for, as they don’t care about quality, they just care about whether or not it fits their standards.
When you throw a bad mix into an even worse algorithmic mastering program, it can completely destroy it, and nobody wants that.
» That’s where Peak Metering and LUFS come in.
A PEAK METER is a type of visual measuring instrument that indicates the (instantaneous) level of an audio signal that is passing through it (a sound level meter).
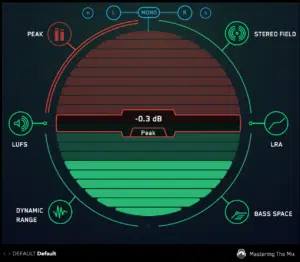
» IDEAL MAX PEAK FOR FINAL MASTER TRACK: -0.3dB.
However, your mix itself should never even think about entering this zone until the mastering stage. Headroom is everything, always remember that.
They show the peak level at any given point and indicate any clipping, or potential clipping so you can adjust accordingly.
You may choose to apply clipping, as it makes a dope signal effect, but that type of clipping was specifically designed for audio; resulting in (pleasing) harmonic-based distortion effects.
The type of distortion that results from unwanted clipping, on the other hand, is one of the most harmonically unpleasing sounds found in audio today.
It is scientifically proven to be despised by the unconscious brain and should be avoided at all costs.
These meters are fairly simple to use, just make sure you don’t clip at any time, during any stage of the mixing or uploading process. Ample headroom should always be left, especially for this reason.
You can bring it up to commercial standards during the mastering process if need be.
The amount of headroom you decide to implement can be based on personal preference (or by random) as long as it’s low enough to ensure you will never clip.
» Anything under (approximately) 12-14dB is sufficient 一 but the lower, the better.
You only have to worry about maxing out the levels as high as possible when mastering.
Having to turn up the level of the playback is a worthy price to pay in order to save your entire mix from destruction, that’s for sure.
A LUFS [Loudness Units relative to Full Scale] METER on the other hand is a more crucial factor when it comes to uploading to specific platforms. They use a LUFs measurement system to determine if a track is dynamically suitable for their platform.
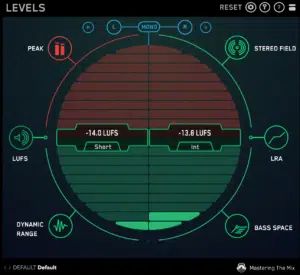
In simplest terms, it is a standardized measurement of audio-loudness that factors human perception (perceived loudness) and electrical signal.
» Spotify for instance has a target volume level of -14 LUFS.
So, if your track hangs out around there for the duration of your song (give or take a little) you’re in good shape. If not, you need to adjust it beforehand, or Spotify will.
» Create and adjust a version of your master for each platform based on their target-range level.
It’s the only way to guarantee your track won’t get reprocessed by their algorithm.
4. GAIN REDUCTION METERS
When it comes to mixing with compression and/or limiting 一 whether your intention is to visually analyze or not 一 the most valuable meter is the Gain Reduction Meters found within Dynamic Processors (Compressors and Limiters).
Ironically, they tend to be the least accurate as well, as it displays elements you can’t always hear, and doesn’t always register the ones that can (at least, not without certain quirks that take getting used to).
This accuracy is, of course, dependent on the developer and plugin itself.
Sometimes even the best ones don’t always display accurate information, and when dealing with analog, the only thing you can trust is that you can’t trust it.
Most show less reduction than is actually occurring… however, the amount in which it’s off by is usually consistent.
Meaning, you just have to add back the amount of dB that it’s off by (roughly) but are still able to make accurate assessments as long as you adjust properly.
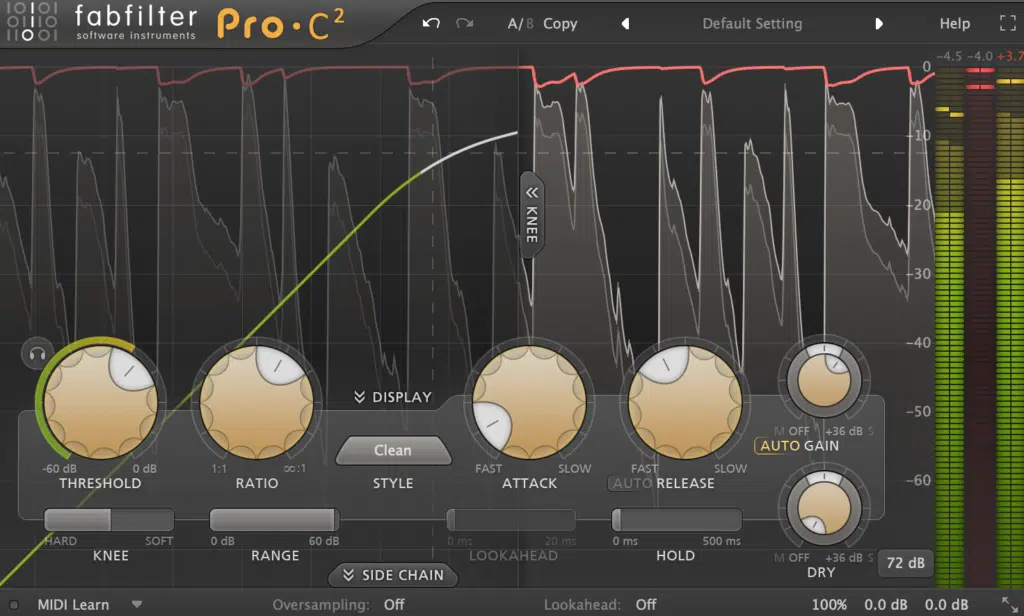
GAIN REDUCTION METER 一 indicates how much gain reduction a particular dynamic processor is applying to the signal you feed it.
The amount of gain reduction you aim to apply is determined by many factors, including:
- The signal you’re working with
- The signal’s overall purpose
- The stage within the mix it’s being applied during (such as the difference between mix & master compression)
Our compression article dives into that in-depth, which you can check out here.
Compression is tricky, and it’s typically hard to tell when you’re overdoing it. Oftentimes, even the best of us don’t realize that too much compression was added.
» Don’t apply compression without at least consulting the meter in the process. When you can’t trust your ears, trust your eyes and vice versa.
The whole moral of this article is that it’s never wise to depend solely on one or the other. It’s the perfect combo of both that will ensure the best results.
By using these meters throughout the compression process, you can easily back off, or apply more when necessary.
In most cases, unless you’re trying to completely slam your signal, the proper amount of gain reduction is found right around the time you start seeing it register on the meter.
Below, you can see I’m using Waves L2 Limiter in order to lightly limit a drum loop. My goal is to apply around 4dB of Gain Reduction.
You can see how low the threshold is in order for the gain-reduction to even get ignited. This should always be the case if you left enough headroom in the mix.
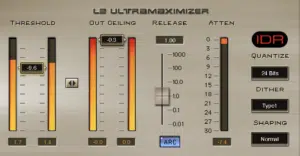
» Knowing the meter intimately… if my goal is 3dB of gain reduction, I know when it registers at 1dB, it’s usually perfect.
As soon as I start seeing it register on the meter, I know I should be good to go. Of course, that’s after careful consultation with my ears and eyes, of course.
You may ask what the point is, but think about it… every scale needs to be calibrated.
That’s why, as I mentioned, it’s super important to learn the accuracy of your meter in order to utilize and adjust them properly.
NOTE: These meters should be used more as a guide, not a measuring stick, so in this particular circumstance, it’s necessary to use both your eyes and ears.
» Each meter and visual feedback technique all have their specific roles, but they should always communicate with each other as well.
FINAL THOUGHTS
Learning how to analyze music isn’t as daunting as one may think… it’s all about the perfect combination of sight and sound, not just one or the other.
In the analog world, there were virtually no visual tools (for obvious reasons) but times have changed, and if you implement old-school techniques, you’ll get old-school results.
» Modern times call for modern measures.
The perfect way to learn and refine these methods is to compare & contrast using high-quality sounds and samples, so you’re able to see/hear what professional audio should look/sound like.
Sooner or later, with the help of your ears AND eyes, analyzing audio will become second nature.
To get started, grab any (or, better yet, all) of the FREE sample packs from our Unison Essential Series so you have every element you’d need right in front of you.
Until next time…


