Spectrograms are all about visualizing sound and showing you exactly how frequency content changes over time.
They can help you scope out hidden audio problems, fine-tune amplitude, and clean up unwanted frequency spectrum buildup.
Plus, they let you identify masking issues, enhance your dynamic range, and shape your sounds with insane precision.
As a producer, understanding what is a spectrogram will seriously improve the way you mix, master, and edit audio 一 making your tracks sound way cleaner.
That’s why I’m breaking down everything you need to know, like:
- How a spectrogram display actually works ✓
- What frequency resolution is & why it matters ✓
- How to fix audio problems & repair audio the right way ✓
- Using waveform display & spectrogram analysis together ✓
- How to balance fundamental frequency & harmonics ✓
- Fixing frequency masking in kick & bass mixing ✓
- Spectrogram settings to clean up vocals ✓
- Using a spectrogram for identifying & recreating sounds ✓
- Much more about what is a spectrogram ✓
Once you know how to read and use a spectrogram, you’ll be able to make better mixing choices, clean up audio recordings, and get the most out of every track.
Plus, be able to remove unwanted vibration signals, sharpen your time or frequency graph, and lock in different frequencies with total control.
This way, your tracks will sound tighter, have better clarity, and hit harder, and you’ll be using spectrograms like a boss in no time.
Table of Contents
What is a Spectrogram & How Does it Work?
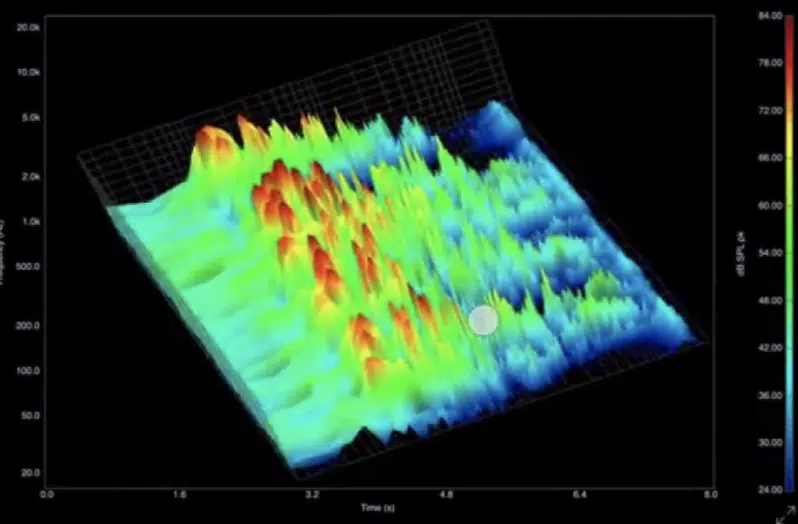
A spectrogram display gives you a visual representation of sound, showing how the frequency content of an audio recording changes over time.
Instead of just seeing waveform’s amplitude peaks, a spectrogram display adds a third dimension of information using color intensity.
It represents amplitude at different frequencies:
- The horizontal axis represents time
- The vertical axis represents frequency
- The color scale represents how loud each frequency spectrum is at any specific moment
When mixing, mastering, or repairing audio, a spectrogram helps you pinpoint audio problems like electrical noise and unwanted harmonics.
Plus any dynamic range inconsistencies as well, too.
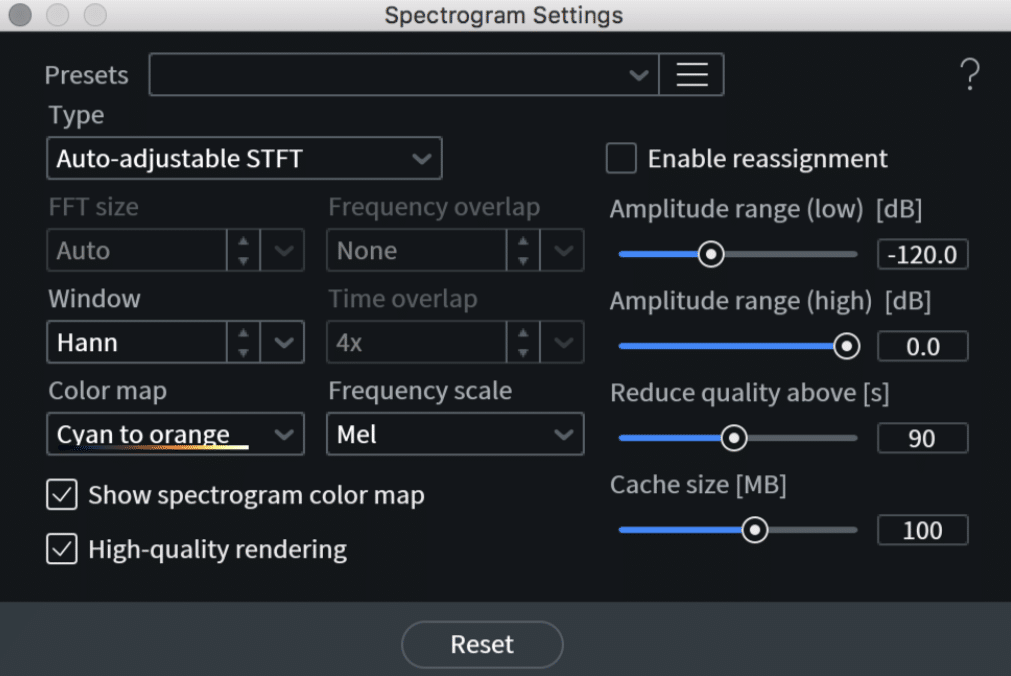
By adjusting spectrogram settings, you can fine-tune the frequency resolution to focus on low frequencies or high frequencies (depending on what needs fixing, of course).
Whether you’re working with percussive sounds, vocals, or full mixes, spectrogram analysis helps you make precise adjustments.
Ones that would be pretty hard to detect just by listening.
Don’t worry, we’ll be breaking it all down in detail throughout the article.
The Spectrogram View
To fully understand what is a spectrogram, you need to break down its main display and how to read it. A spectrogram display consists of three key elements: time, frequency, and amplitude, which provide a detailed look at the entire audio file’s waveform. So, let’s get into it.
-
Axes: Time, Frequency, and Amplitude
A spectrogram display is built around three essential elements:
- Time
- Frequency
- Amplitude
Each one provides key information about your audio recording.
The horizontal axis represents time, which lets you see how the entire audio file evolves from start to finish.
This is super useful when identifying sudden percussive sounds like snare hits or transients in a drum loop.
The vertical axis represents frequency.
It ranges from low frequencies (20 Hz and below, where sub-bass sits) to high frequencies (20 kHz and above, where cymbals and vocal sibilance appear).
Unlike a waveform overview, which only shows waveform’s amplitude peaks, a spectrogram display visualizes individual frequencies in detail.
For example, if you’re struggling with frequency masking, you can see where the kick drum and bass overlap around 50–120 Hz and make precise EQ adjustments.
The amplitude is represented by color intensity; brighter colors indicate louder strong signals, while darker colors show quieter individual frequencies.
Adjusting the FFT (fast fourier transform) size in your spectrogram settings changes the frequency resolution.
It gives you either more detail in low frequencies (longer windows, such as 4096 samples) or better time resolution for detecting fast transients (shorter windows, such as 512 samples).
By fine-tuning these parameters, you can easily pinpoint unwanted harmonics, subtle vibration signals, or hidden audio problems that might be ruining your mix.
-
Color Intensity & What it Represents
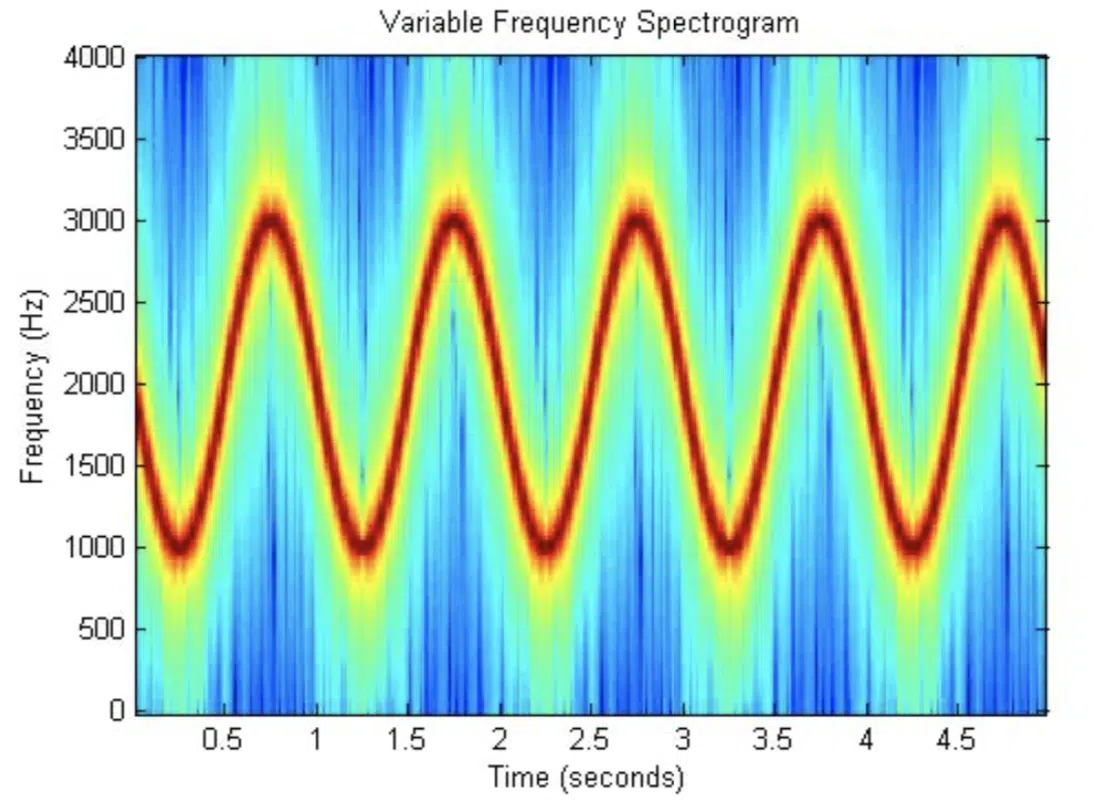
A spectrogram display uses color intensity to represent the amplitude of each individual frequency in an audio recording.
The brighter or more intense the color, the louder the frequency spectrum at that specific moment in time.
Most spectrogram settings allow you to customize the color scale, but by default:
- Hotter colors (reds, yellows, and oranges) indicate higher amplitude.
- Cooler colors (blues and purples) represent lower amplitude.
This makes locating strong signals super easy, such as a vocal peak at 2 kHz or an overly resonant fundamental frequency in a bassline around 80 Hz.
For example, when mixing a vocal track, you might notice that high frequencies in the sibilance range (5–10 kHz) appear as bright streaks.
This can help you determine the exact area to target with a de-esser or dynamic EQ rather than applying broad adjustments.
On the same note, in a drum mix, you might see excessive brightness in the low frequencies 一 revealing a muddy kick drum that needs tightening.
Understanding how spectrogram’s color scale identifies different frequency content helps you make precise adjustments, which leads to a much cleaner mix.
Remember, when you’re learning about what is a spectrogram, it’s all about the subtleties, and after that, it’s pretty simple.
Types of Spectrograms & When to Use Them
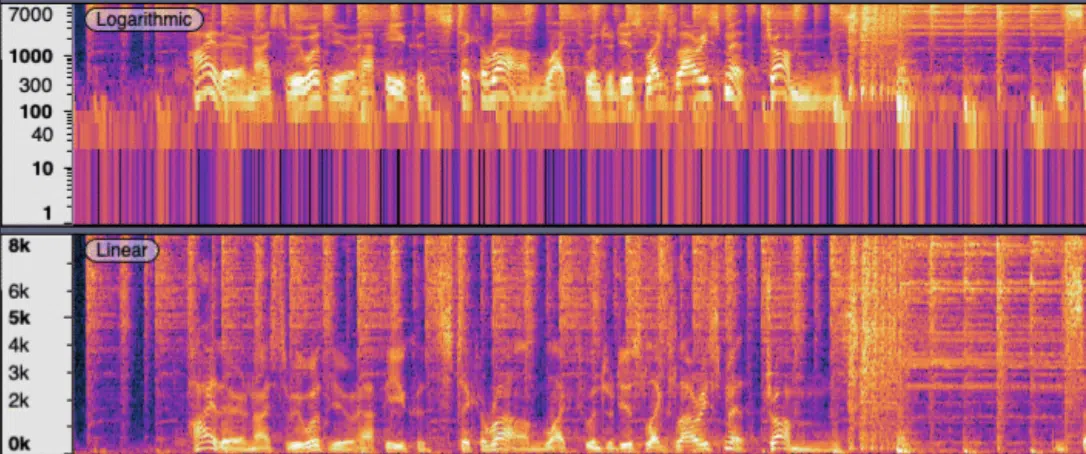
Not all spectrogram displays are the same, and the type you choose will depend on what aspect of the audio recording you’re analyzing.
The two most common types are:
- Linear spectrograms
- Logarithmic spectrograms
A linear spectrogram represents frequency spectrum equally across the vertical axis 一 making it better for detecting high frequencies and subtle transients.
This could be things like spoken words or percussive sounds.
A logarithmic spectrogram, on the other hand, mimics human hearing by emphasizing low frequencies.
It’s for tasks like kick and bass mixing or detecting rumble in the sub-bass.
Another factor to consider is time resolution vs. frequency resolution, which depends on the FFT size setting:
A smaller FFT size (e.g., 512) gives better time resolution, which makes it much easier to analyze quick changes, such as a snare transient.
A larger FFT size (e.g., 4096) increases frequency resolution, which makes it better for detecting unwanted harmonics or tuning issues in sustained notes.
Some spectrograms also allow overlap control, which smooths out the transition between frames, providing a more detailed visual representation of continuous sound.
For mastering, a high-resolution spectrogram is useful for spotting unwanted vibration signals or tonal imbalances in the frequency spectrum.
For mixing, a real-time spectrogram with adjustable spectrogram settings can help identify audio problems like dynamic range inconsistencies or waveform display clipping.
So remember, when you’re learning what is a spectrogram, choosing the right spectrogram type is super important to make your workflow on point.
Just as important as adjusting its main display settings.
Spectrograms for Mixing & Mastering
When working on a mix, what is a spectrogram if not one of the most powerful tools for identifying problem areas in your audio recording? A spectrogram display helps you spot frequency masking, balance low frequencies, mid frequencies, and high frequencies, and even pinpoint harsh harmonics or unwanted resonances that may be muddying up your mix as you know now, but let’s break it down further.
-
Identifying Frequency Masking
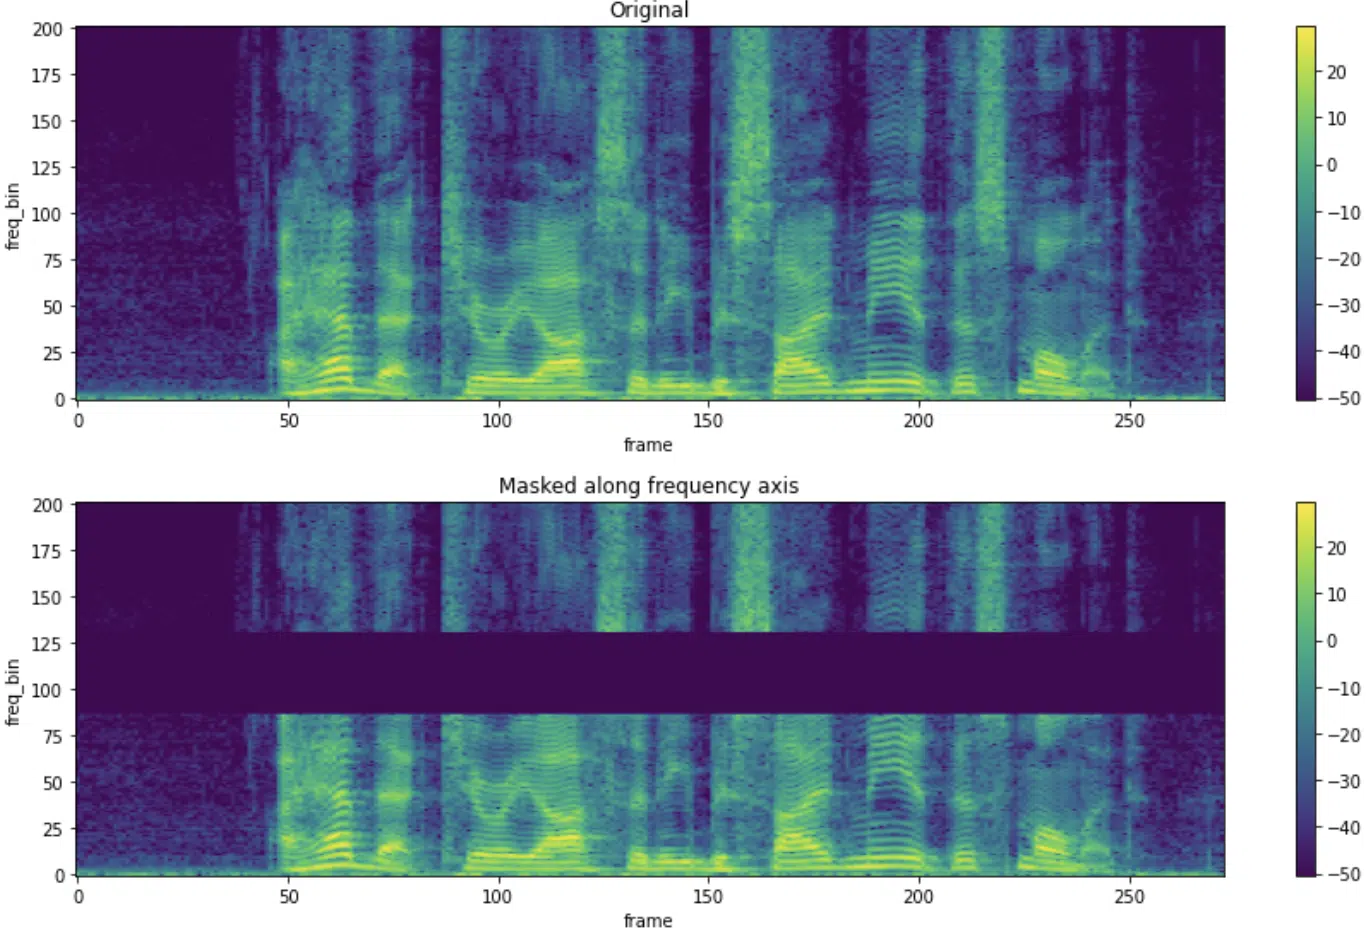
Frequency masking happens when two sounds with similar frequency content overlap, causing one to drown out the other.
This is a major issue in mixing, especially between:
- Kick drums and basslines
- Vocals and synths
- Guitars and pianos
If your kick drum and bass are clashing in the 50–120 Hz range, you’ll notice a dense concentration of bright colors in that specific area.
This tells you that both elements are competing for space and usually appears as an overlapping band of energy extending horizontally across the spectrogram display.
This reduces the punch and makes the mix sound muddy, so you’d need to fix that.
Using spectrogram analysis, you can apply a dynamic EQ to duck the bass slightly whenever the kick hits, which prevents muddiness while maintaining a solid low-end.
In most cases, setting a dynamic EQ band around 50–80 Hz, with a reduction of 2–3 dB, helps the kick cut through while keeping the bass present, but always tweak to situation.
Using a sidechain compressor with a fast attack (1–5ms) and a medium release (50–100ms) can also help create better separation so the bass recovers after each kick hit, so keep that in mind as well.
You can also use FFT size adjustments in your spectrogram settings to zoom in on specific individual frequencies, which helps you decide whether to boost or cut.
And remember what we talked about with FFT size:
A larger FFT size (4096 or 8192 samples) increases frequency resolution, making it easier to see precisely where overlapping fundamental frequencies exist.
If you need to analyze transient-heavy material like drums or short synth stabs, reducing the FFT size to 512 or 1024 samples will improve time resolution.
By analyzing the frequency spectrum, you can carve out space for each instrument 一 ensuring clarity and separation in the mix.
If vocals and synths are fighting in the 2–3 kHz range, you can use the spectrogram display to see which one has dominant amplitude in that range and apply a small EQ dip (1–2 dB) to the synth for better vocal clarity.
If your guitars and pianos are masking each other in the high mids, you might see overlapping energy spikes around 3–5 kHz.
This can be cleaned up using spectrogram settings to isolate and notch out just the right amount.
NOTE: By tweaking spectrogram settings like overlap percentage (80–90%) for smoother transitions and fine-tuning your dynamic EQ and compression settings, you’ll be able to fix frequency masking with precision.
This will give your mix clarity, depth, and proper instrument separation.
-
Balancing Low, Mid, and High Frequencies
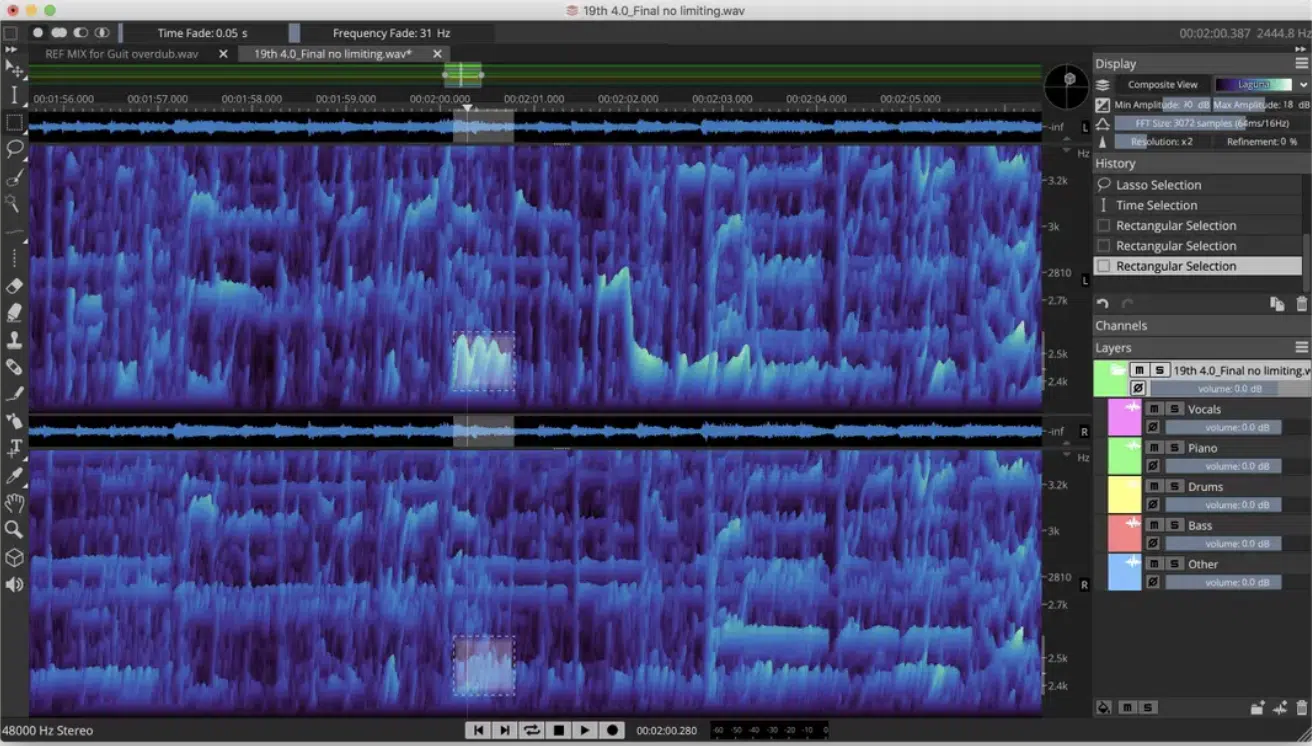
A well-balanced mix distributes frequency content evenly across the low frequencies, mid frequencies, and high frequencies without any section overpowering the rest.
A spectrogram display allows you to visualize this balance and make precise adjustments to ensure no range is too dominant or too weak.
If your mix has too much low-end energy, you might see excessive brightness around 30–80 Hz, indicating the need for a subtle high-pass filter to clean up sub-bass rumble.
On the other hand, if the high frequencies appear faint or dull in the spectrogram display, your mix may lack air and presence.
A slight shelf boost around 10–15 kHz can add clarity to vocals and cymbals without making them harsh.
The midrange, which carries the bulk of musical detail, should be evenly spread across 500 Hz to 4 kHz so no single element takes over the mix.
By carefully analyzing the spectrogram settings, you can fine-tune the amplitude distribution across the entire frequency spectrum for a clean, professional sound.
-
Fixing Harsh Resonances and Muddiness
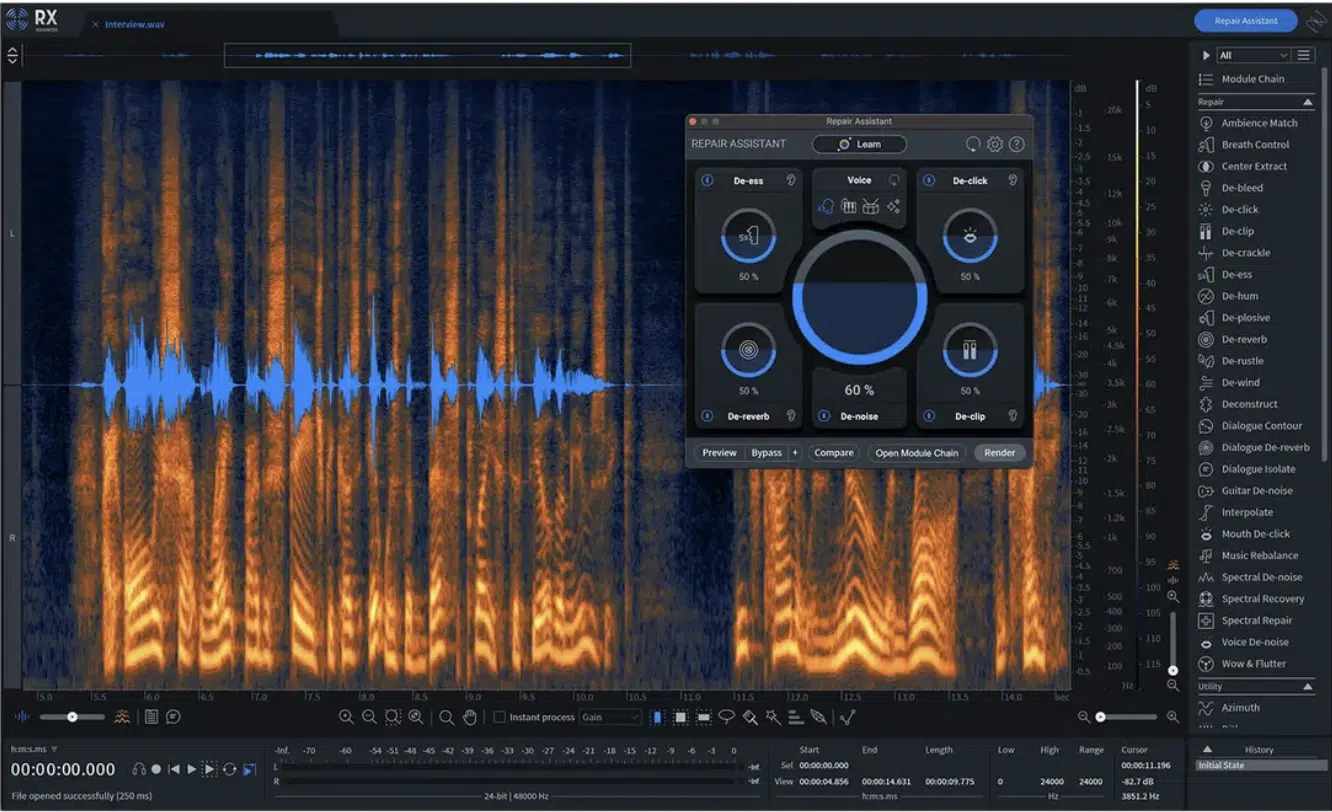
Harsh resonances and muddy frequencies can make a mix sound unbalanced, fatiguing, cluttered, and straight up unprofessional.
The spectrogram display helps you identify these problem areas by revealing bright vertical lines in the frequency spectrum.
It indicates an overactive fundamental frequency or a problematic harmonic like we talked about.
For example, if a snare drum has an irritating ring around 3–5 kHz, it will show up as a distinct, narrow stripe in the spectrogram analysis.
To fix this, you can use a narrow-band EQ cut at the precise fundamental frequency to reduce the unwanted ringing without affecting the rest of the mix.
On the same note, muddiness often builds up in the 200–400 Hz range, where excessive low-mid frequencies create a boxy, congested sound.
By analyzing your spectrogram display and adjusting spectrogram settings, you can pinpoint exactly where the issue lies and apply corrective EQ moves to enhance clarity.
This makes it much easier to achieve a super clean mix without guesswork.
Using Spectrograms for Sound Design
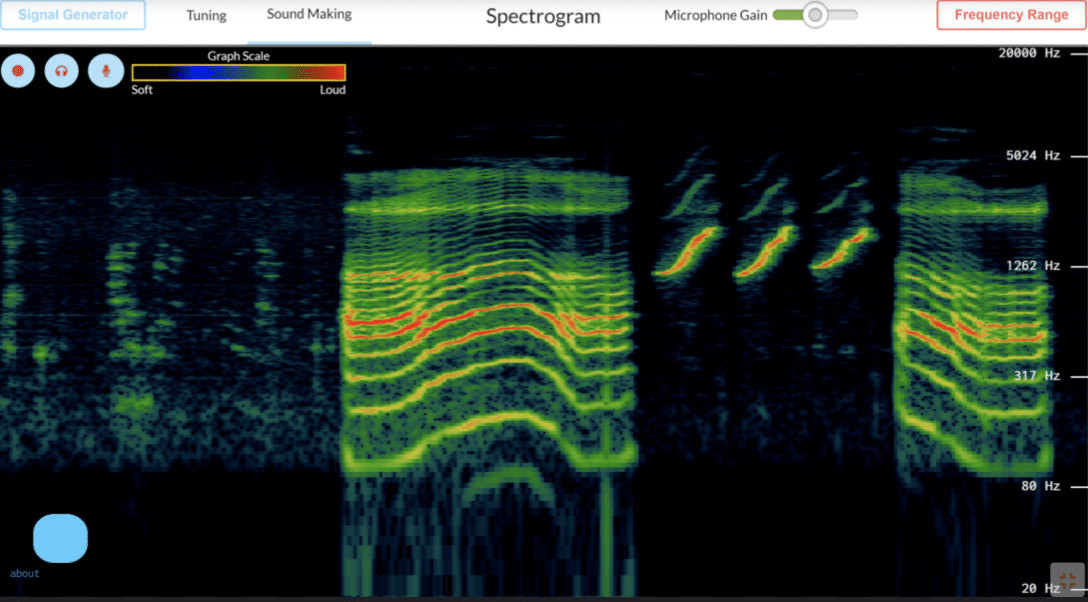
A spectrogram display isn’t just for fixing audio problems, you can also use it to create insane textures, shape percussive sounds, and knock out unique effects.
Instead of relying only on your ears, you can visually track frequency content, fundamental frequency, and harmonics.
It makes a huge difference when tweaking sound layers.
For example, if you’re designing a cinematic impact or futuristic vibration signal, you can see exactly how the frequency spectrum builds over time and layer in sub-bass at 30–50 Hz for extra weight or add high frequencies at 10 kHz+ for shimmer.
You can even “draw” sound into the spectrogram display using spectral editing tools like iZotope RX.
With it, you can manually select individual frequencies to carve out unique, glitchy textures which is actually pretty sick.
If you boost delicate harmonics in the high frequencies, you can even add sparkle to ambient pads or make lead synths cut through a mix better.
Adjusting the FFT size in your spectrogram settings changes how much detail you see as we covered, so don’t forget about as well.
Playing around with spectrogram analysis, EQ, and creative filtering gives you a completely different way to shape sound that’s impossible with just a waveform display.
PRO TIP
Since a spectrogram correlates peak values with frequency content, you can use it to break down the fundamental frequency and harmonics of any sound.
If you want to know what is a spectrogram for, this is one of my favs.
For example, if you want to recreate the punch of a classic 808 kick, analyzing a reference track’s spectrogram display will show exactly where the low frequencies peak.
Whether that’s around 40 Hz or 60 Hz you’ll know exactly what to target in your sound design.
You can also use spectrogram analysis to study synth patches.
If a lead synth has a wide, airy presence, you’ll see strong high frequencies around 10–15 kHz, while a warm pad will have a dense mid-frequency range between 500 Hz and 3 kHz.
Analyzing the continuous waveform display alongside the spectrogram helps you match not only the frequency spectrum but also the waveform’s amplitude peaks.
It gives you a full picture of how a sound behaves.
If you’re trying to sample a sound but there’s unwanted background noise, increasing the FFT size improves frequency resolution.
This way you can isolate individual frequencies and remove distractions.
Cleaning & Repairing Audio: Summing it Up
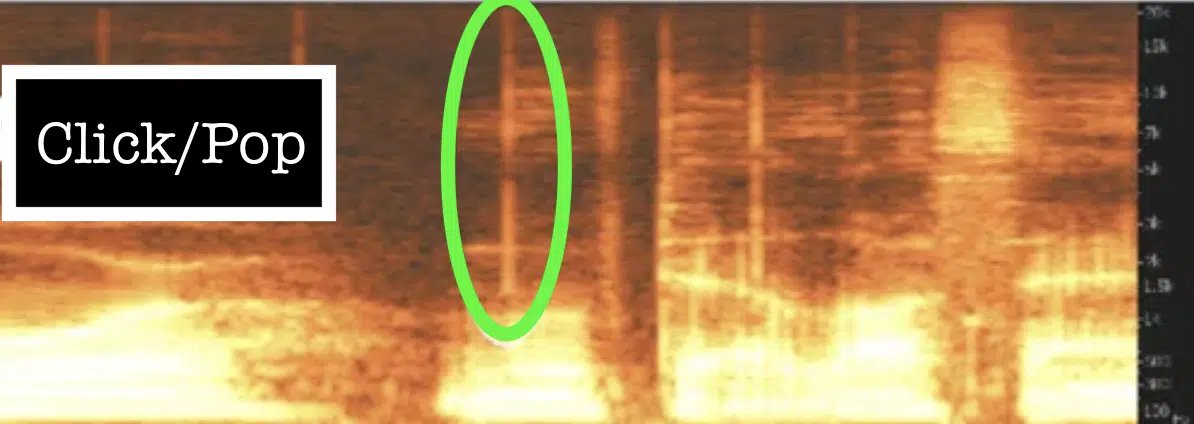
If you’ve ever had a great audio recording ruined by unwanted noise, a spectrogram display can help you fix it without damaging the rest of your track.
Unlike a waveform overview, which only shows waveform’s amplitude peaks, a spectrogram display lets you zero in on individual frequencies.
This makes it easier to remove:
- Hums
- Pops
- Clicks
- Harsh noises
If you see a constant bright horizontal line around 60 Hz, that’s probably an electrical hum 一 you can cut it out cleanly with a notch filter in a spectral editor.
Clicks and pops show up as tiny, sharp vertical lines, usually in the high frequencies.
Instead of using a regular EQ, which might mess with the clarity of your track, tools like Spectral Repair or De-click let you remove just the unwanted noise.
If you’re trying to clean up background noise, adjusting your spectrogram settings to a high FFT size like 8192 samples gives you better frequency resolution.
For transient issues like mic pops or snare spikes, a smaller FFT size (512–1024 samples) gives you better time resolution, letting you clean things up surgically.
Using a spectrogram display for repairing audio gives you way more precision than guessing with a traditional EQ.
Final Thoughts
And there you go: everything needed to answer what is a spectrogram.
With this information and these new techniques, you’ll be able to identify frequency masking, clean up audio problems, and fine-tune every detail of your mix.
Plus, you’ll have the skills to balance low frequencies, enhance vocal clarity, and fix muddiness like a boss.
Just remember that it’s all about reading the spectrogram correctly and not just relying on a waveform display alone.
And, as a special bonus, you’ve got to check out these legendary Free Sample Packs that are making major waves in the industry right now.
Everything from basslines and melody loops to beatmaker templates and full project files is all here.
They’re professionally crafted, designed for maximum impact, and guaranteed to make your tracks stand out and dominate the competition.
Regardless of genre or style, there are tons of high-quality samples waiting for you 一 plus, they’re all 100% free, so it doesn’t get much better than that.
Bottom line, when it comes to what is a spectrogram, it’s all about using it to visualize sound in ways a waveform can’t.
It helps with mixing, mastering, sound design, and repairing audio while giving you total control over every frequency in your track.
Just remember to always adjust spectrogram settings based on what you’re analyzing, and fine-tune EQ and compression using what you see, not just what you hear.
This way, your tracks will sound cleaner, hit harder, and have way more clarity, and you’ll be using spectrograms like a pro.
Until next time…


Leave a Reply
You must belogged in to post a comment.