The Fletcher-Munson curve is more than just a technical term; it’s essential knowledge for aspiring or established music producers.
Grasping this concept can help you master the art of mixing, bringing clarity and balance to your tracks.
Understanding how the human ear perceives different frequencies at various volume levels gives you an edge that can significantly elevate your tracks.
This article covers everything you need to know about the Fletcher Munson curve to harness its principles and refine your craft.
We’ll be breaking down:
- How the Fletcher-Munson curve works ✓
- Its relevance to music production ✓
- The science between the Fletcher Munson curve ✓
- Equal loudness contours vs. equal loudness curves ✓
- Perceived loudness & its unique role ✓
- The impact of different frequencies on the human ear ✓
- dB SPL significance ✓
- Essential tips & tricks using the Fletcher Munson curve ✓
- Much more ✓
After this article, you’ll be able to grasp the intricacies and nuances of the Fletcher Munson curve and implement it like an expert.
As well as gain expert tips, tricks, techniques, and secrets to help your music sound even more pristine and professional.
So, let’s dive in…
Table of Contents
- What Exactly is The Fletcher Munson Curve?
- Why Should Music Producers Care About the Fletcher Munson Curve?
- Breaking Down the Basics
- The Fletcher Munson Curve: Practical Applications
- A Producer’s Guide to Frequencies
- Tips, Tricks, and Techniques for the Digital Producer
- Fletcher Munson Curve: Final Thoughts
What Exactly is The Fletcher Munson Curve?
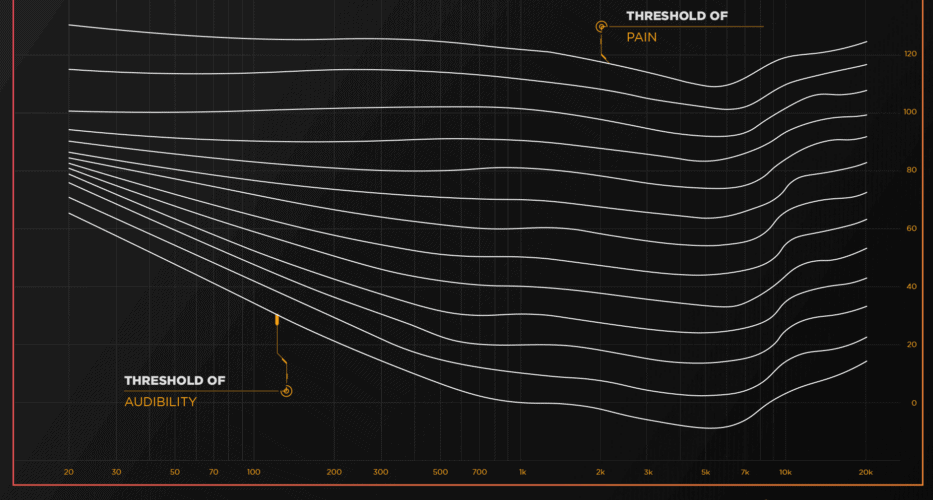
The Fletcher Munson curve refers to a set of equal loudness contours that describe how the human ear perceives loudness at different frequencies.
In the 1930s, two gentlemen plotted equal loudness contours to understand how this process worked.
Their names were:
- Harvey Fletcher
- Wilden A. Munson
These curves show that our ears don’t hear all frequencies at the same loudness, even when played at equal sound pressure levels or dB SPL.
If you’ve ever wondered why certain frequencies in your mix sound louder or quieter than others (even if the volume meter suggests otherwise), it’s the Fletcher Munson curves at work.
So, you can thank Fletcher and Munson for that one.
In essence, it’s all about how our human ears interpret the various sounds.
These curves have profound implications, especially for music producers 一 let’s delve into why it’s so pivotal.
Why Should Music Producers Care About the Fletcher Munson Curve?
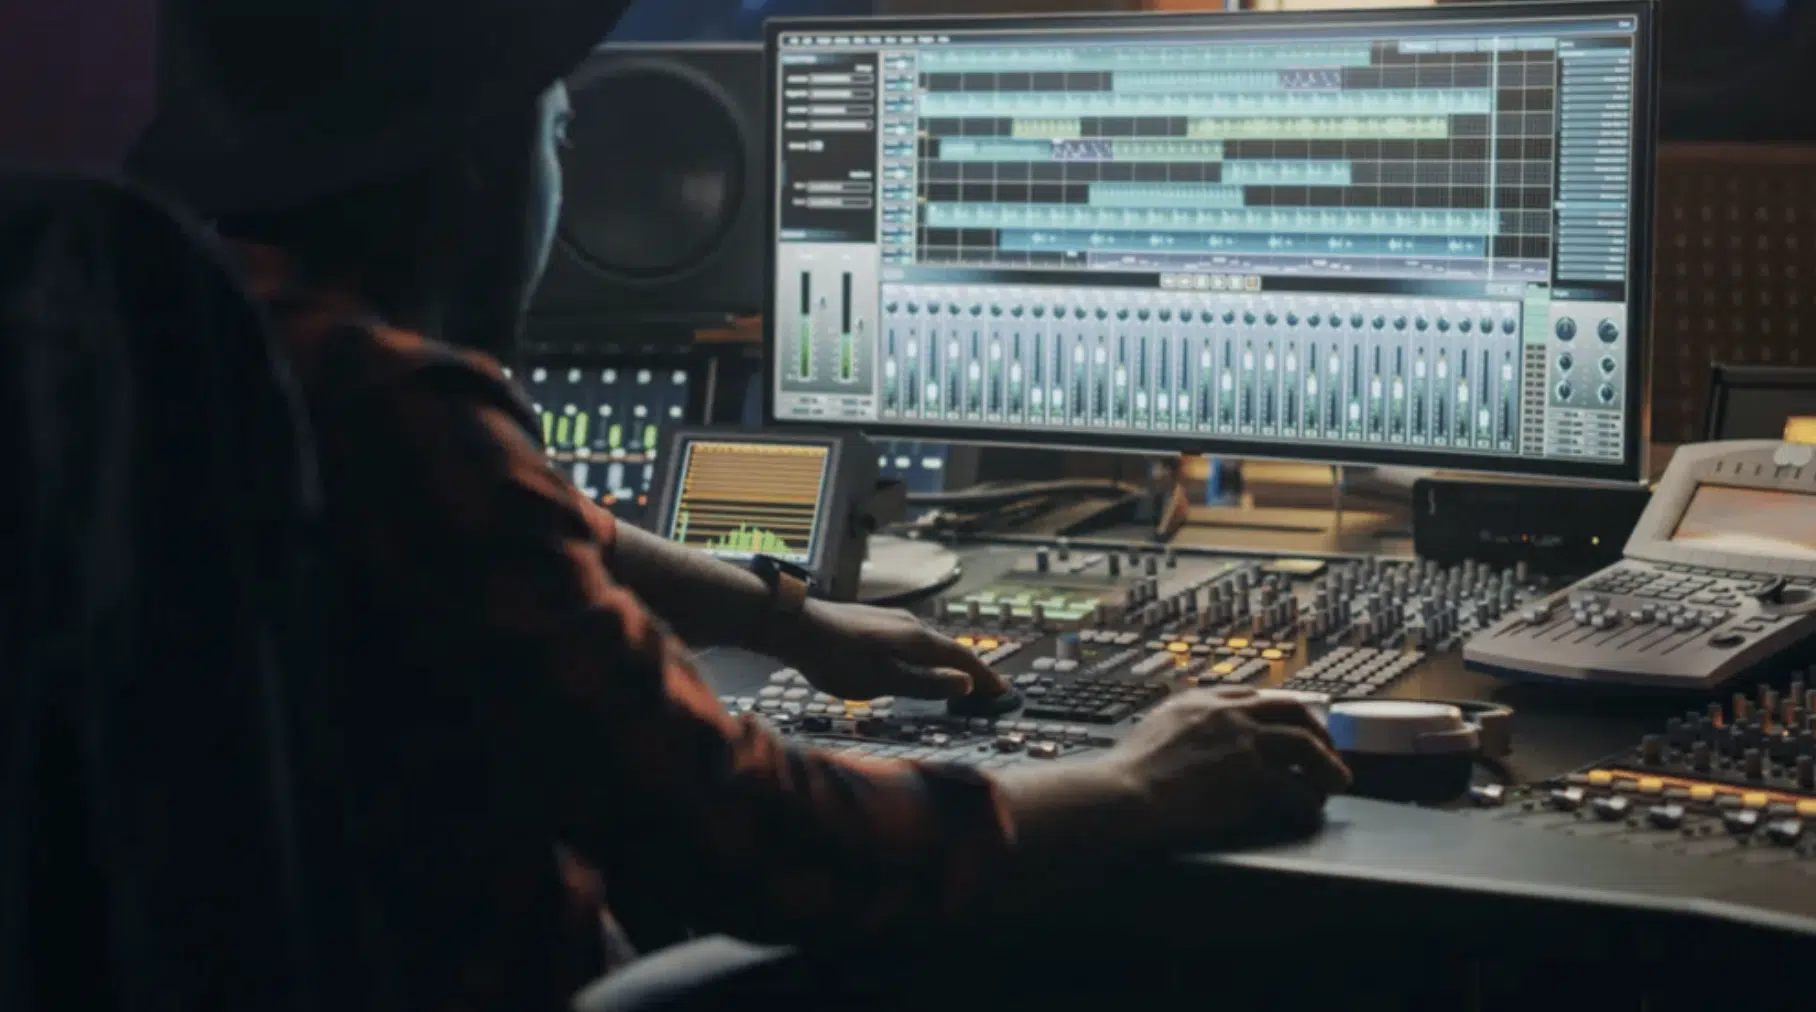
As digital music producers, achieving the right tonal balance in our tracks is crucial.
When it comes to mixing, understanding the Fletcher Munson curve can be the key to creating sounds that are:
- Full
- Balanced
- Engaging across different playback systems
Think about it for a second…
If your mix sounds great at high volumes but loses its punch at lower volumes, it’s likely because you’re not considering how perceived loudness shifts at different frequencies.
This is where the curve steps in as your guide.
Plus, with the rise of streaming platforms, music is often played on various devices 一 from high-end studio monitors to cheap earbuds.
A keen awareness of the Fletcher Munson curve ensures your tracks sound consistent across these varying playback conditions.
Beyond just the technical side, it’s about understanding your audience.
If listeners perceive a track as unbalanced or certain elements too prominent or hidden, they might skip to the next song.
Let’s break down the basics so you can prevent that.
Breaking Down the Basics
Now that we’ve established its importance let’s unpack the intricate details of the Fletcher Munson curve and how it interacts with our music production process.
We’ll start with the science behind Fletcher Munson curves and then move on to Fletcher Munson contours/curves and perceived loudness.
-
The Science Behind the Fletcher Munson Curve

At its core, the science behind the Fletcher Munson curve revolves around our ear’s non-linear response to different frequencies.
While machines linearly measure sound, our ears certainly don’t.
We are more sensitive to certain frequencies, especially regarding the mid-range.
NOTE: The human ear is most sensitive to frequencies that lie between 2kHz to 4kHz.
This is the region where the human voice lies, and evolutionarily, it’s believed that our ears developed this way to prioritize human speech.
On the contrary, low and high frequencies must be played at higher SPL to be perceived as equally loud to mid frequencies.
That’s why bass frequencies might need a boost in your mix to be felt adequately.
It’s also worth noting that as the overall volume or SPL (Sound Pressure LeveL) increases, the difference in perceived loudness across frequencies diminishes.
This phenomenon can be a trap for producers mixing at high volumes.
-
Equal Loudness Contours vs. Equal Loudness Curves
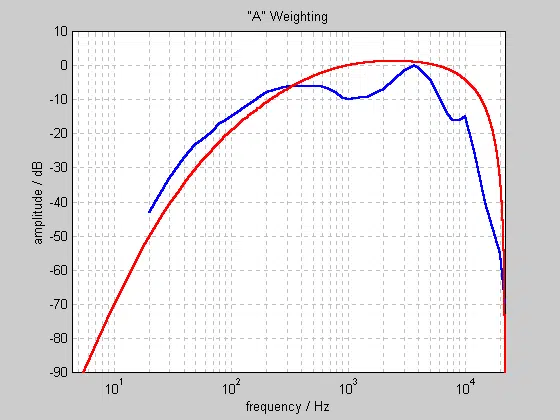
While they might sound similar, there’s a difference between equal loudness contours and equal loudness curves.
The equal loudness contours represent our ear’s sensitivity at various frequencies and volumes.
The original Fletcher Munson curves, the earliest representations of the equal loudness contour, were based on the findings of their pioneering research.
However, the ISO 226 standard was developed over time as more studies were conducted.
This represents a more accurate depiction of human hearing.
While the Fletcher Munson curves laid the foundation, the equal loudness contours (as outlined by the ISO 226 standard) give us a more refined view.
As a music producer or artist, these contours are your roadmap to ensuring perceived balance across your mix.
As for equal loudness curves, they’re essentially slices of the 3D contour model 一 representing the equal loudness perception at specific volume levels.
In simpler terms, these Fletcher Munson curves showcase how various frequencies must be adjusted to sound equally loud at a given volume.
To visualize Fletcher Munson curves at work, imagine a 3D landscape of peaks and valleys; each slice through this landscape, at a specific altitude represents an equal loudness curve.
It’s this intricate landscape that guides our mixing decisions or mixing mistakes.
-
The Role of Perceived Loudness
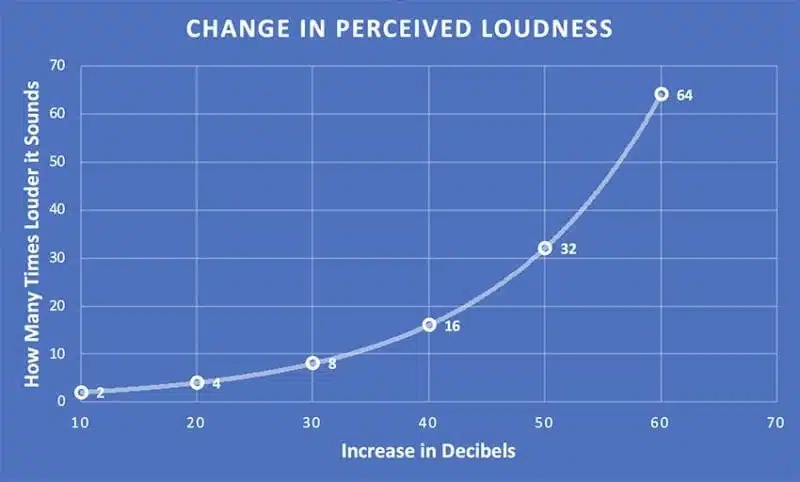
Perceived loudness, or perceived volume, refers to how the human ear interprets the volume of a particular sound, which can often differ from its actual measured volume.
It’s not just about the intensity of the sound but how our ears and brains interpret it.
This phenomenon has become increasingly significant in music production, like the Chromatic Scale.
Say, for example, you have a snare drum and a bassline playing at the same measurable volume.
The snare might sound more prominent because our ears are more sensitive to its frequency range.
Another aspect to consider is the duration of the sound 一 longer sustained sounds are often perceived as louder than short, transient sounds (even if their peak volumes are the same).
This principle is crucial when balancing elements like lush pads versus percussive hits in a mix.
When aiming for a balanced mix, you should rely not just on meters but also on your ears.
Trusting one’s own perception, in light of the Fletcher Munson curve, can be the key to a mix that feels right.
-
Breaking Down dB SPL & Its Significance
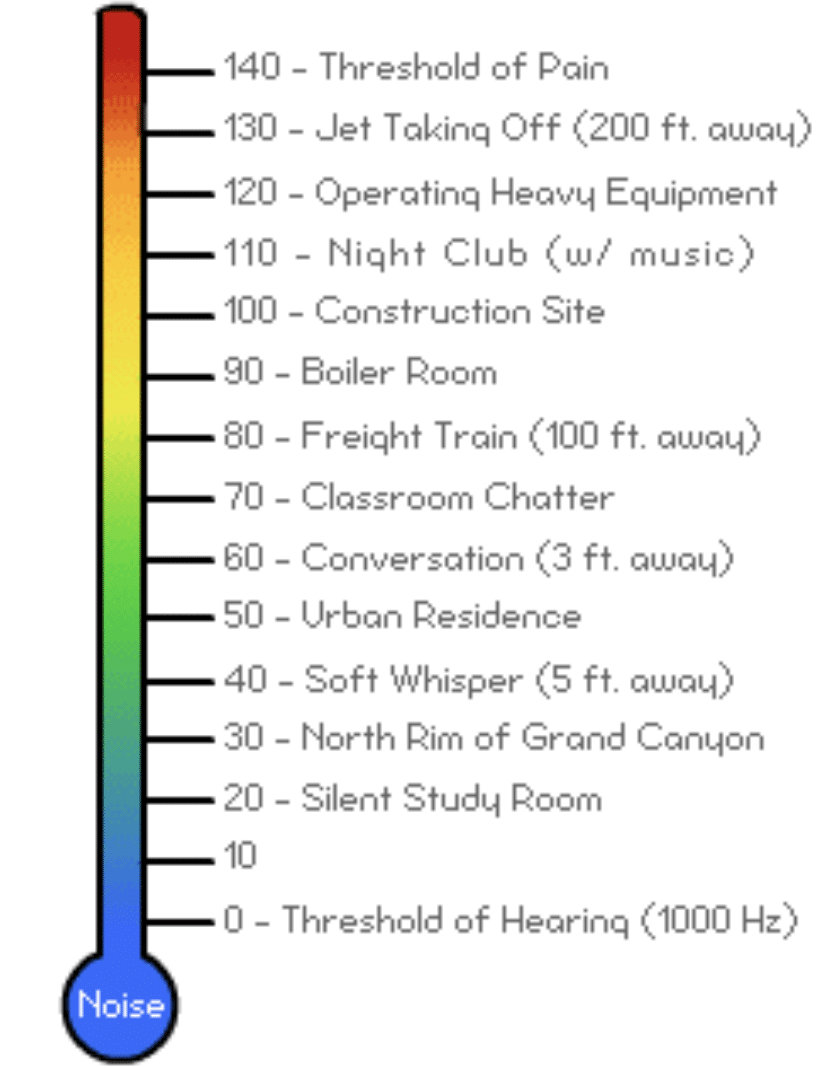
dB SPL, or decibels sound pressure level, is a measure of sound pressure, essentially quantifying the intensity of a sound in the air.
It’s crucial to understand that our ears don’t perceive changes in SPL linearly.
A 10 dB increase is typically perceived as roughly double the loudness, even though it represents a tenfold increase in intensity.
This non-linear perception further complicates the mixing process.
It means that a slight boost in dB might have a profound impact on the perceived loudness 一 especially in those frequencies where our ears are most sensitive.
For digital music producers like yourself, understanding dB SPL in the context of the Fletcher Munson curve is vital.
It allows for informed decisions on volume boosts and/or cuts.
Therefore, it ensures that the mix translates well across different systems and listening conditions, like headphones.
The Fletcher Munson Curve: Practical Applications
With a deeper understanding, let’s focus on the practical applications and how this knowledge can be harnessed for optimal music production.
-
How The Fletcher Munson Curve Influences Music Production & Mixing

The Fletcher Munson curve is a constant, silent guide when making a beat, whether in your home studio or a professional studio/setting.
It subtly dictates how listeners will perceive your mix at various volumes.
For example, when mixing at lower volumes, you might feel inclined to boost the bass to ensure it’s felt…
However, this can lead to an overpowering bass when the track is played louder, so it’s a balancing act guided by the curve.
NOTE: In music production and sound design, understanding that a complex sound wave often originates from simpler sine waves at diverse frequencies is key.
Similarly, when mastering for streaming platforms, understanding perceived loudness can ensure consistency.
Platforms like Spotify and Apple Music use loudness normalization 一 making dynamic and consistent mixes in perceived loudness more desirable.
Therefore, awareness of the curve’s implications can lead to more informed mixing decisions.
As well as ensures that the end product sounds its best across various listening scenarios.
-
Importance of Tonal Balance
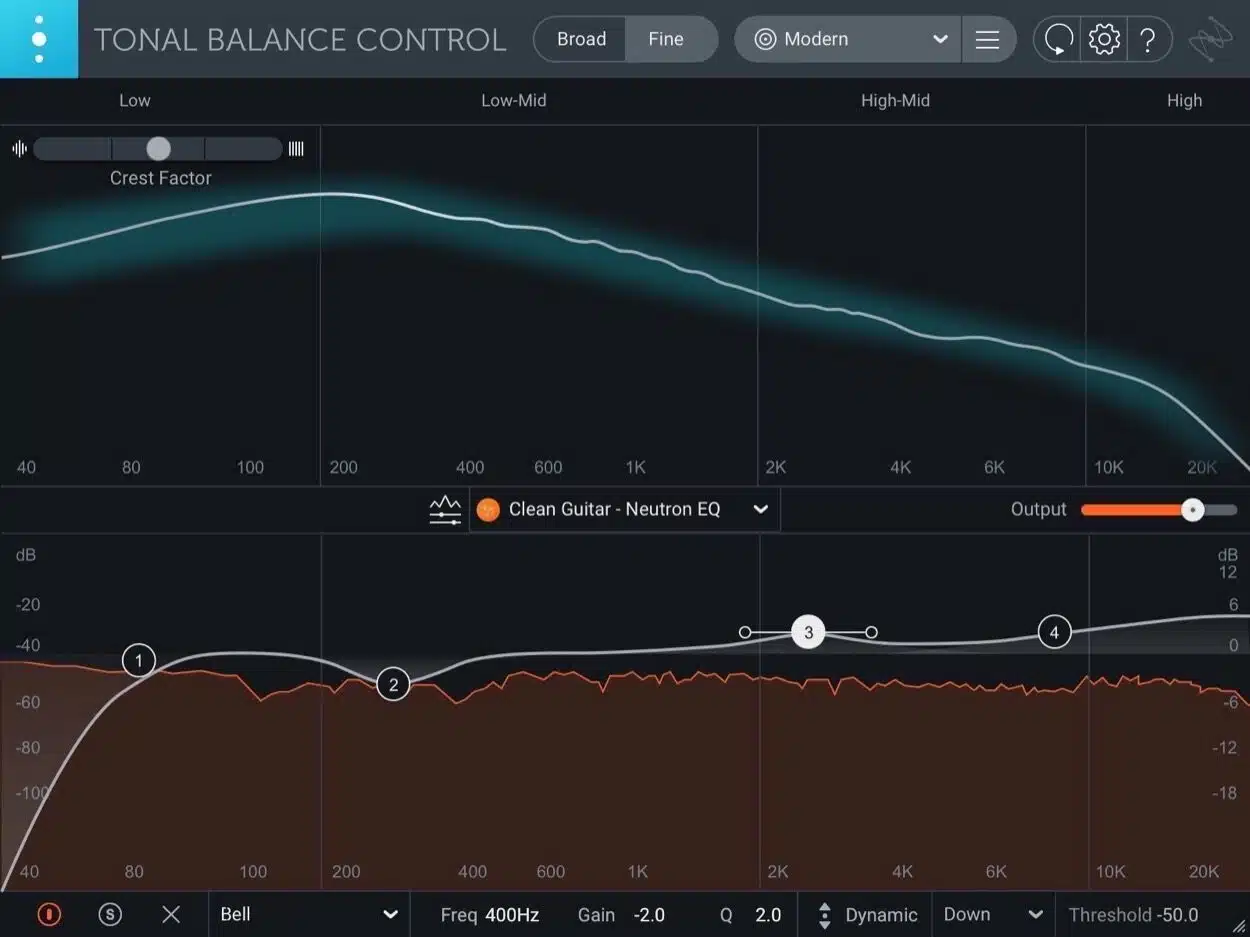
Tonal balance, in a mixing setting, refers to the equilibrium between the:
- Bass
- Mids
- Treble
Achieving the right balance ensures that no frequency range overpowers another.
The Fletcher Munson curve directly impacts this balance.
A mix that is too bass-heavy might sound muddy at low volumes due to our ears’ reduced sensitivity to these frequencies.
Similarly, an overly bright mix might sound pleasing at lower volumes but become piercing and fatiguing when turned up.
When you’re mixing, it’s essentially a pursuit of the ideal tonal balance.
So, always remember how the human ear perceives different frequencies at varying volumes (perceived loudness).
-
Achieving the Right Volume in Your Tracks
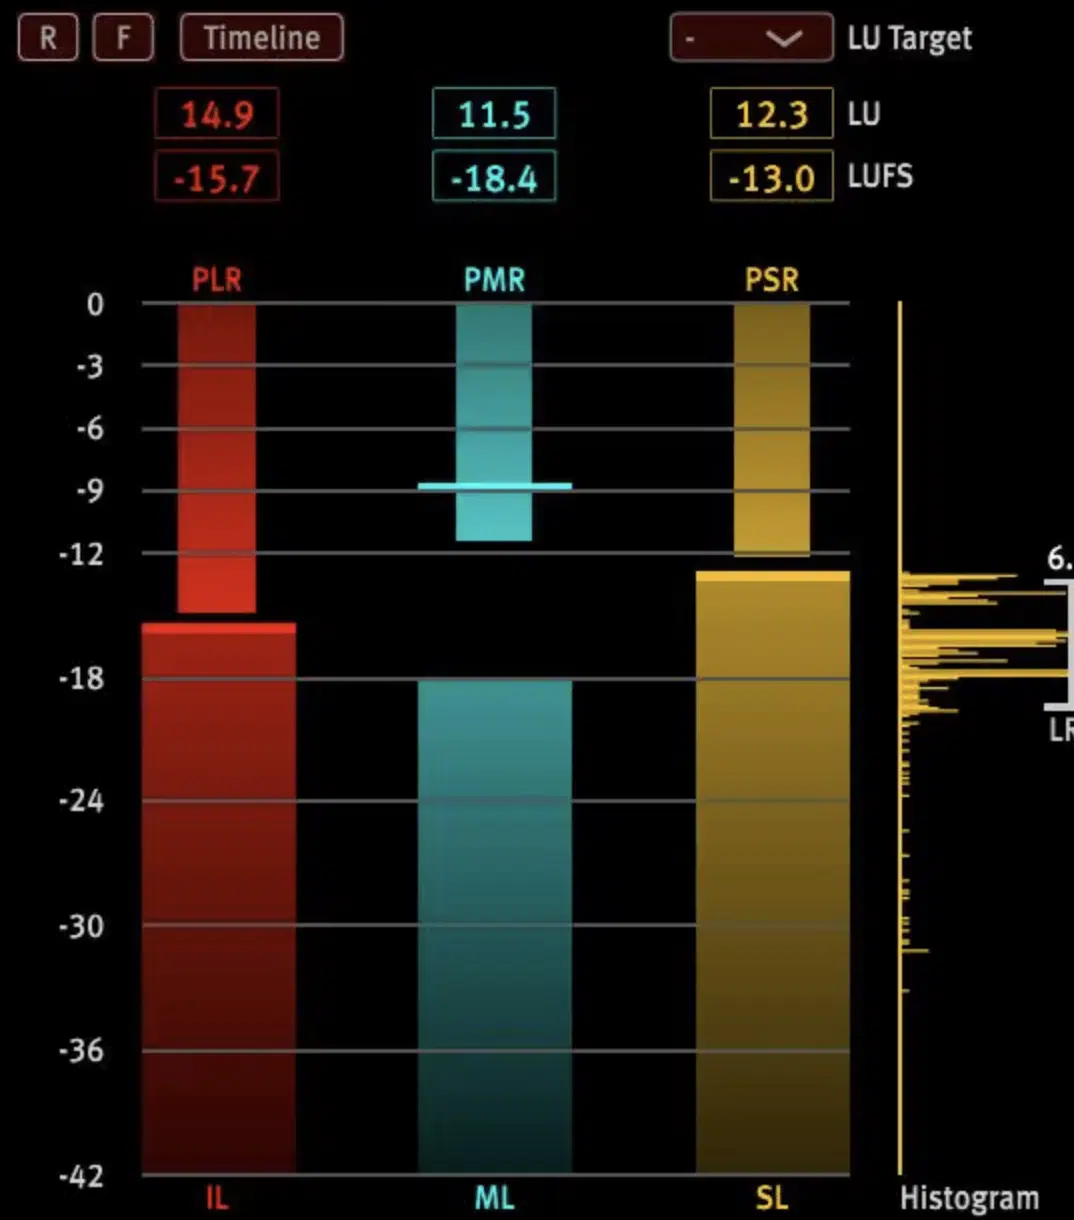
Beyond frequency considerations, the Fletcher Munson curve also informs the overall volume decisions in a mix.
- Tracks mixed too quietly 一 Might lack energy and presence.
- Those mixed too loud 一 Risk distortion and a loss of dynamics.
Remember, perceived loudness isn’t just about raw volume but how different elements within the mix interact and are perceived by the listener.
Using tools like LUFS meters, which measure perceived loudness, in conjunction with the knowledge of the Fletcher Munson curve, can help you reach the ideal volume.
Ultimately, the goal is to create a track that feels energetic and alive.
Without being overly compressed or distorted, irrespective of where or how it’s played.
Speaking of, if you’d like access to the correct compression settings, we’ve got you covered.
A Producer’s Guide to Frequencies
Understanding frequencies (loudness levels) is crucial for any producer.
By delving into each frequency range, we can harness the strength of each and create more impactful, resonant mixes.
So, let’s get into it…
-
Low frequencies
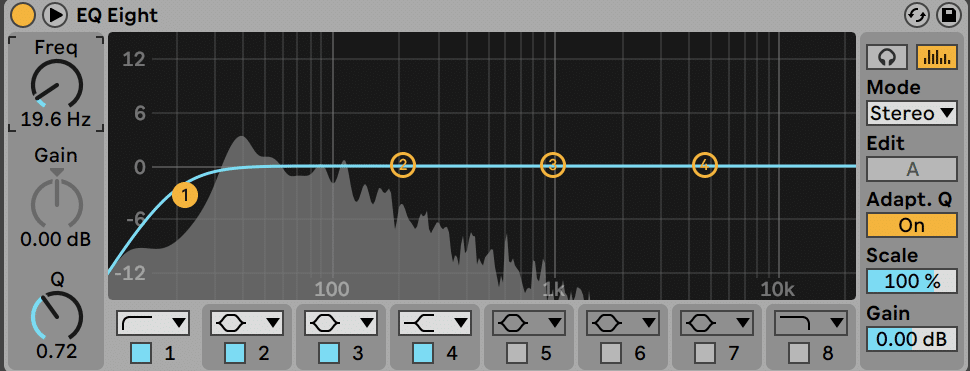
Low frequencies, typically ranging from 20Hz to around 250Hz, form the foundation of most tracks.
They encompass the deep rumbles of:
- Bass guitars
- Kick drums
- Sub-basses
However, managing these frequencies can oftentimes be challenging.
Due to the Fletcher Munson curve, low frequencies need to be more pronounced to be perceived at the same level as mid or high frequencies (especially at lower volumes).
Overloading a mix with low frequencies can cause it to sound muddy.
NOTE: t’s essential to use tools like high-pass filters to clean up unnecessary low-end content from instruments that don’t require it.
In essence, while the low-end provides a track’s weight, it must be managed precisely to maintain clarity and avoid overwhelming the listener.
-
Mid-Range Frequencies
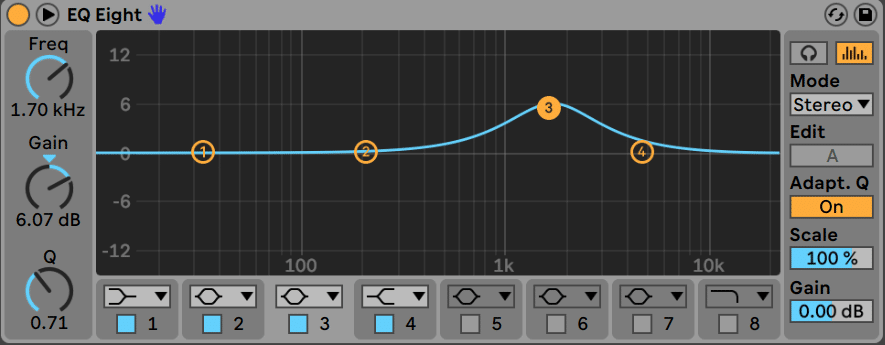
Mid-range frequencies, approximately 250Hz to 2kHz, are where instruments like vocals, guitars, and keyboards live.
These mid-range frequency elements are often called the ‘heart’ of a mix.
Given our ears’ sensitivity to this range, it’s no surprise that any imbalance here is immediately noticeable.
- Too much 一 Can cause a mix to sound honky or nasal.
- Too little 一 Might render it lifeless or hollow.
A common challenge is ensuring that vocals (a primary mid-range component) stand out without overshadowing other elements.
NOTE: Techniques like EQ carving, where space is created in the frequency spectrum for particular instruments, can be invaluable here.
I can’t emphasize how pivotal the mid-range frequencies are.
They carry the emotional weight and narrative of the song 一 demanding careful handling to ensure the track’s message is conveyed effectively.
-
High Frequencies
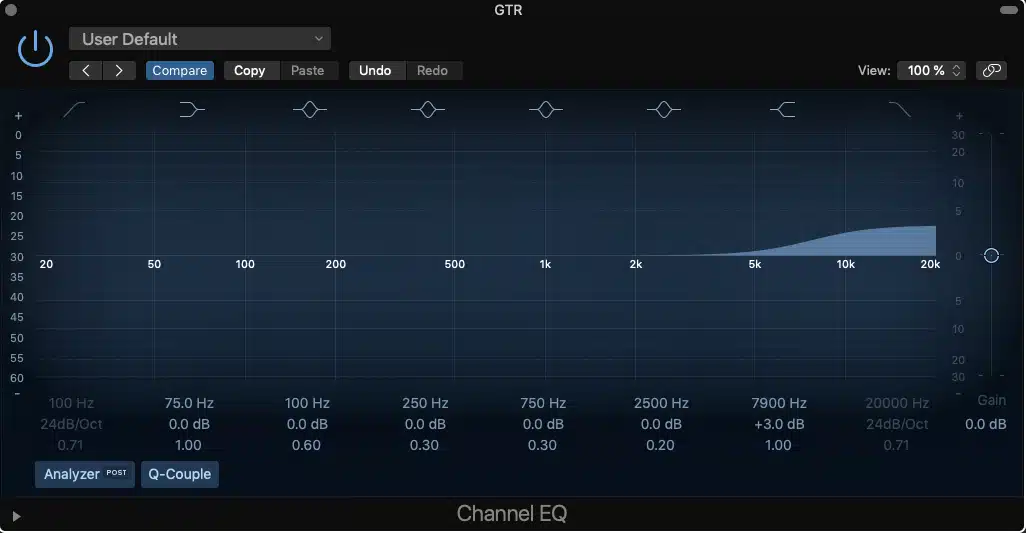
High frequencies, starting from around 2kHz and extending beyond 20kHz, bring clarity, airiness, and ‘sparkle’ to a track.
These frequencies capture:
- The shimmer of cymbals
- The breathiness of vocals
- The sizzle of a snare
While they provide clarity, high frequencies can be tricky.
Too much emphasis can lead to a mix sounding harsh or tinny, leading to listener fatigue.
The Fletcher Munson curve tells us that our ears become less sensitive to these frequencies at lower volumes.
So, while mixing and measuring noise, it’s crucial to cross-check how your high-end translates at different playback levels frequently.
The high-end gives a track its overall sheen or brilliance.
It requires a delicate touch 一 ensuring the mix feels open and clear without becoming abrasive.
Tips, Tricks, and Techniques for the Digital Producer
With foundational knowledge at our fingertips, let’s explore specific techniques and insights that digital producers can apply 一 centered around the Fletcher Munson curve.
#1. Mix at Various Volumes.
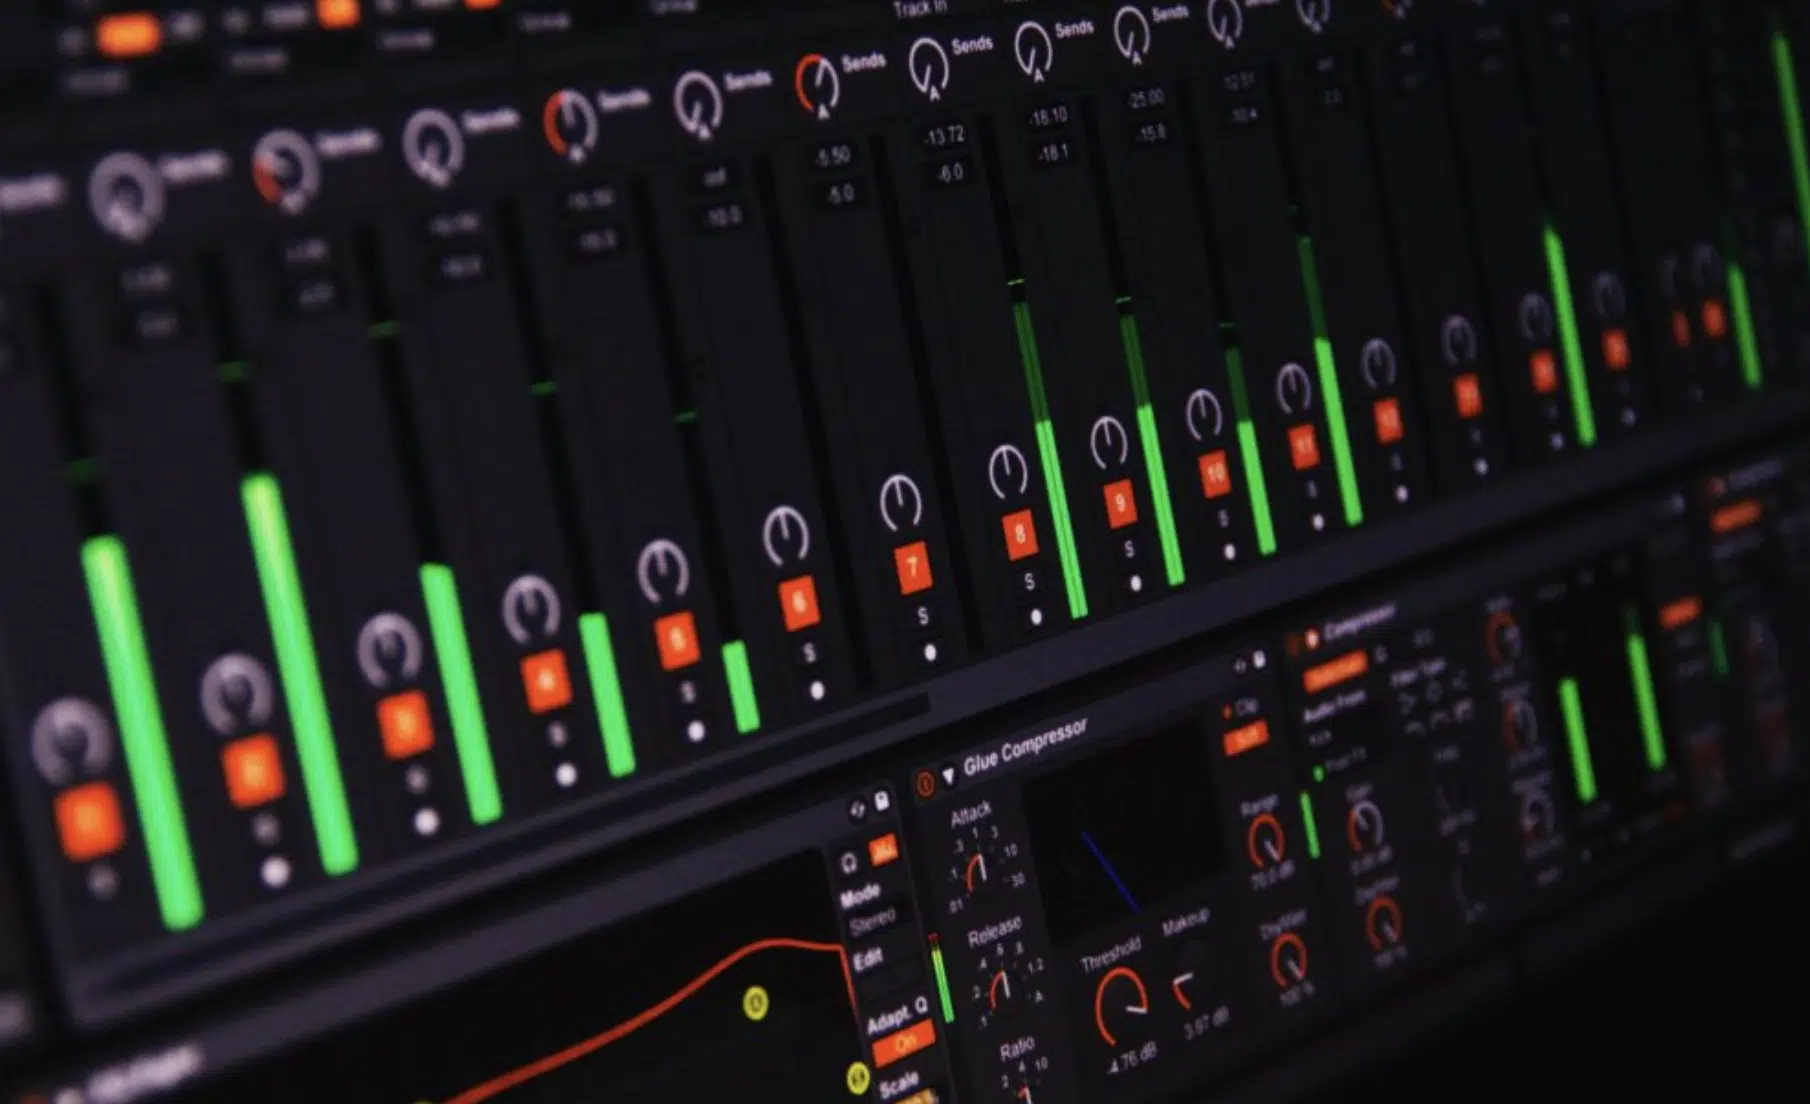
As you adjust the volume, notice how different frequency ranges come forward or recede.
This practice ensures that your mix translates well 一 whether it’s played softly in the background or blaring at a party.
#2. Use Reference Tracks.
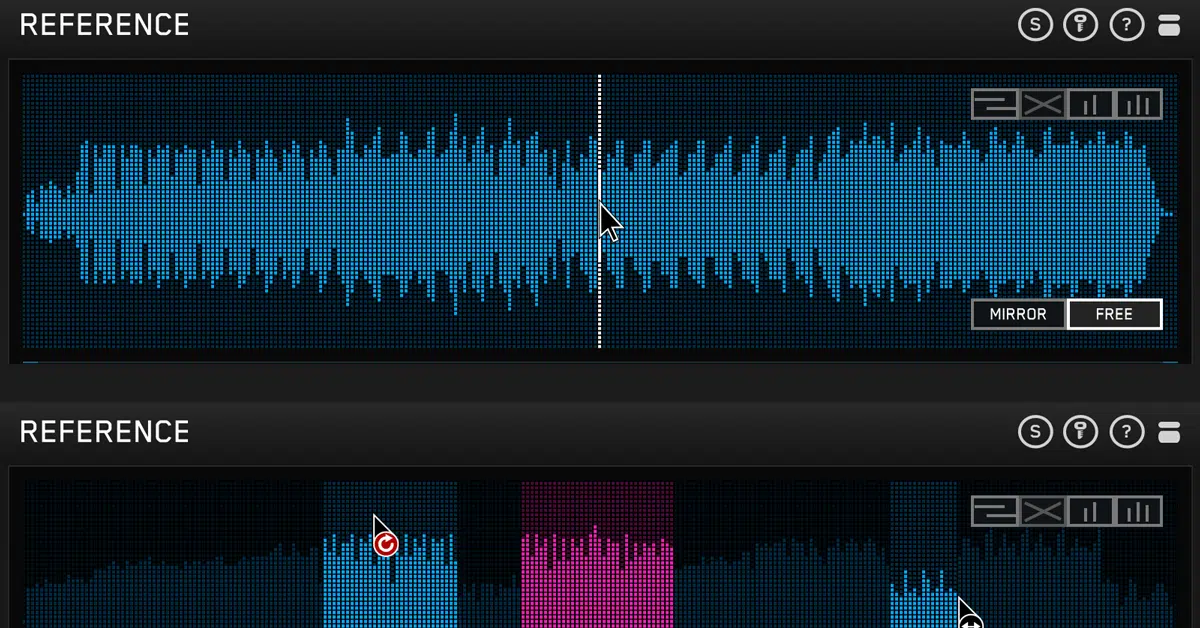
By comparing your mix to a well-produced track in a similar genre, you can gauge how your frequency balance stacks up.
This is particularly true when concerning human ear sensitivity (especially the inner ear of the ear canal).
If you’d like to learn how to use reference tracks like a professional, we’ve got you covered.
#3. Dynamic EQ.
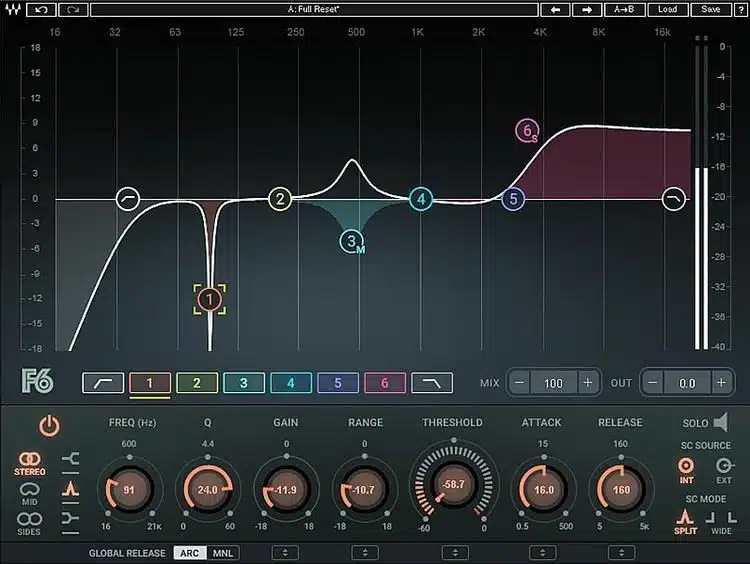
Dynamic EQ allows for frequency-specific volume adjustments based on the mix.
For example, during a loud chorus with a full frequency spectrum, a dynamic EQ can slightly dip the mid-range when the vocals hit a particular volume.
This ensures that they don’t get drowned out.
#4. Multiband Compression.
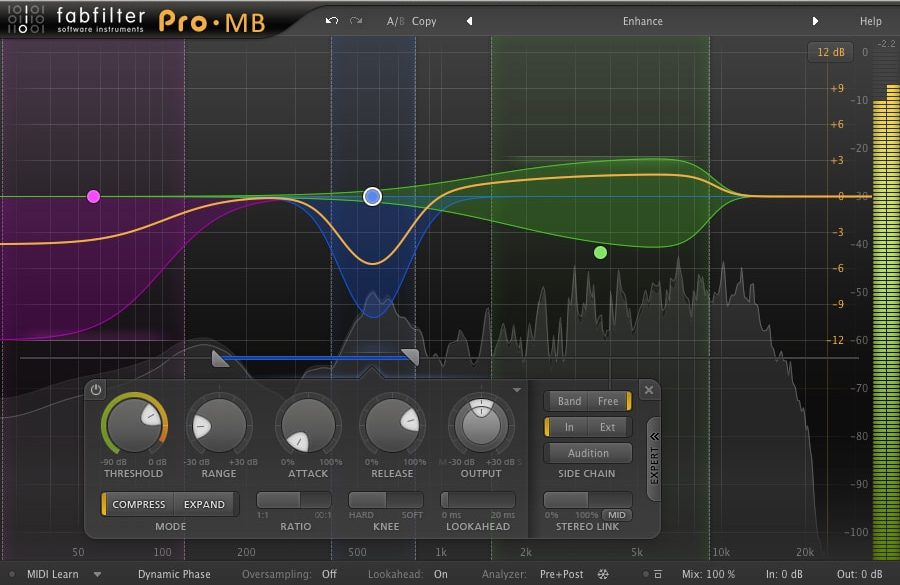
Similarly, multiband compression can be used to control the low end dynamically.
When the bass becomes too overwhelming, the compressor can reduce its volume, which helps you to produce a balanced mix (regardless of the song’s dynamics).
Leveraging these tools, informed by the Fletcher Munson curve, can help you achieve a mix that feels alive and dynamic yet remains clear and balanced.
Fletcher Munson Curve: Final Thoughts
The Fletcher Munson curve is undeniably a cornerstone in the realm of music production.
As you now understand, it’s not just a theoretical concept.
It’s an invaluable tool that can elevate your mixes, enhance the way you perceive sound, and revolutionize the way you approach frequencies.
You’ve not only uncovered the science behind it but also delved deep into its practical applications in a music production setting.
But knowledge is one thing, applying it in real-world scenarios is another…
That’s where these Free Project Files come into play.
With these 3 free project files (available in Ableton, FL Studio, and Logic Pro) you’re handed a golden ticket to peek behind the curtains of professional-quality tracks.
By dissecting these projects, you can witness firsthand how the experts adhere to the Fletcher Munson curve 一 from their EQing choices to their meticulous handling of frequencies.
It’s the best way for you to see, in real-time, how to tangibly apply everything you’ve learned about the curve.
This is your chance to transform your mixes from good to impeccable, mastering the nuances of frequencies just like the pros.
Until next time…


Leave a Reply
You must belogged in to post a comment.