Working with spectrum analyzers can completely transform the way you go about mixing and mastering.
They help you visually identify issues in the frequency spectrum, pinpoint problematic areas, and balance your mix like a boss.
Plus, you’ll be able to demolish problems like masking, phase issues, and dynamic range inconsistencies (which is super important).
This way, you’ll have complete control over your sound and be able to bang out tracks that translate perfectly across all systems.
As producers/audio engineers, this level of insight is invaluable.
And that’s exactly why I’m breaking down absolutely everything you need to know about spectrum analyzers, including:
- What spectrum analyzers are used for ✓
- How spectrum analyzers work ✓
- Key concepts of the frequency spectrum ✓
- Expert tips for using spectrum analyzers in your DAW ✓
- How to balance a mix using spectrum analysis ✓
- Identifying and resolving frequency buildups ✓
- Advanced techniques like mid/side spectrum analysis ✓
- Tweaking analyzer settings for specific tasks ✓
- Exploring 3D spectrograms and their benefits ✓
- Much more about spectrum analyzers ✓
By knowing all about spectrum analyzers, you’ll be able to easily identify and fix tonal imbalances, optimize the clarity of your tracks, and elevate your skills.
Plus, your mixes will be on point and you’ll never have to deal with excessive compression or overlapping frequency bands again.
Muddiness, harshness, and basic tracks will be a thing of the past.
Table of Contents
What Are Spectrum Analyzers Used For?
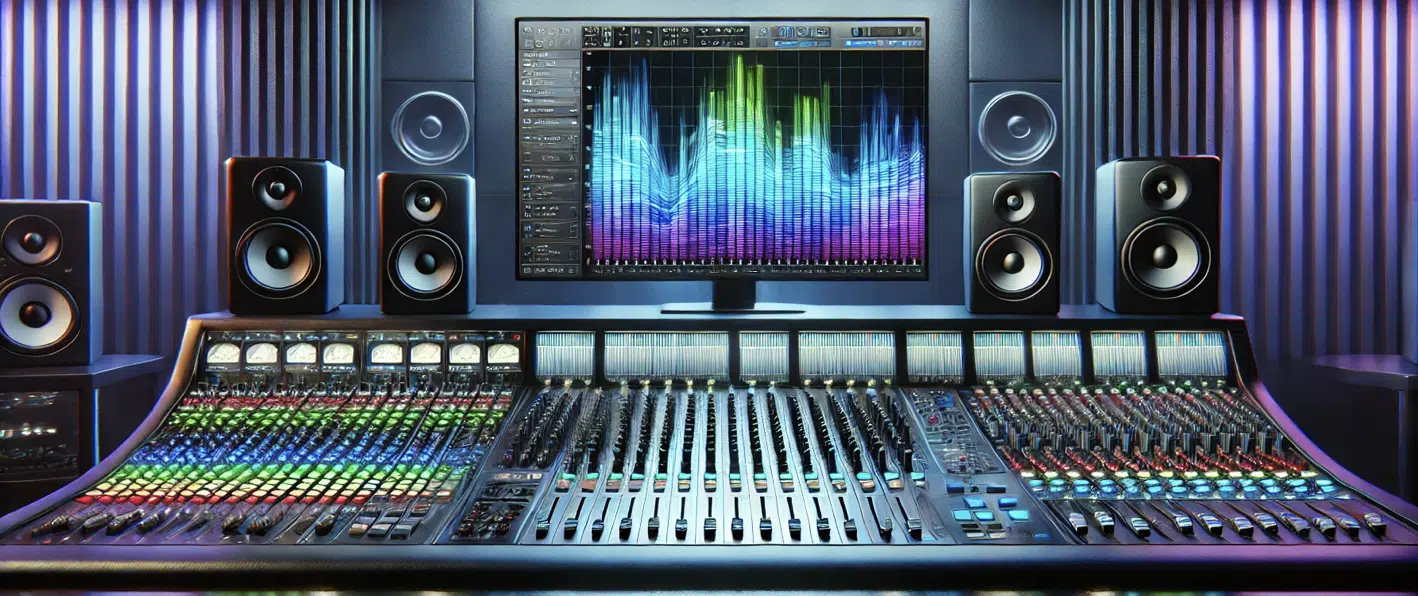
Spectrum analyzers help you see what’s happening across the frequency spectrum of your audio in real time so you can visually see things like:
- Frequency buildups
- Weak signals
- Phase Noise
- Inconsistencies/issues
This way, you can see exactly what is throwing off your mix and fix it.
For example, if your low-end feels cluttered, a spectrum analyzer can show if the sub-bass around 40 Hz is too strong compared to the bass frequencies at 100 Hz.
There are many types (including real-time spectrum analyzers, vector signal analyzers, even a handheld spectrum analyzer) each with their own strengths for different tasks.
Whether you’re working with audio signals or analyzing RF signals, spectrum analyzers make fine-tuning your sound much easier.
Don’t worry, we’ll break everything down in detail throughout the article, but I just wanted to give you a general overview before we dove in.
Understanding the Frequency Spectrum
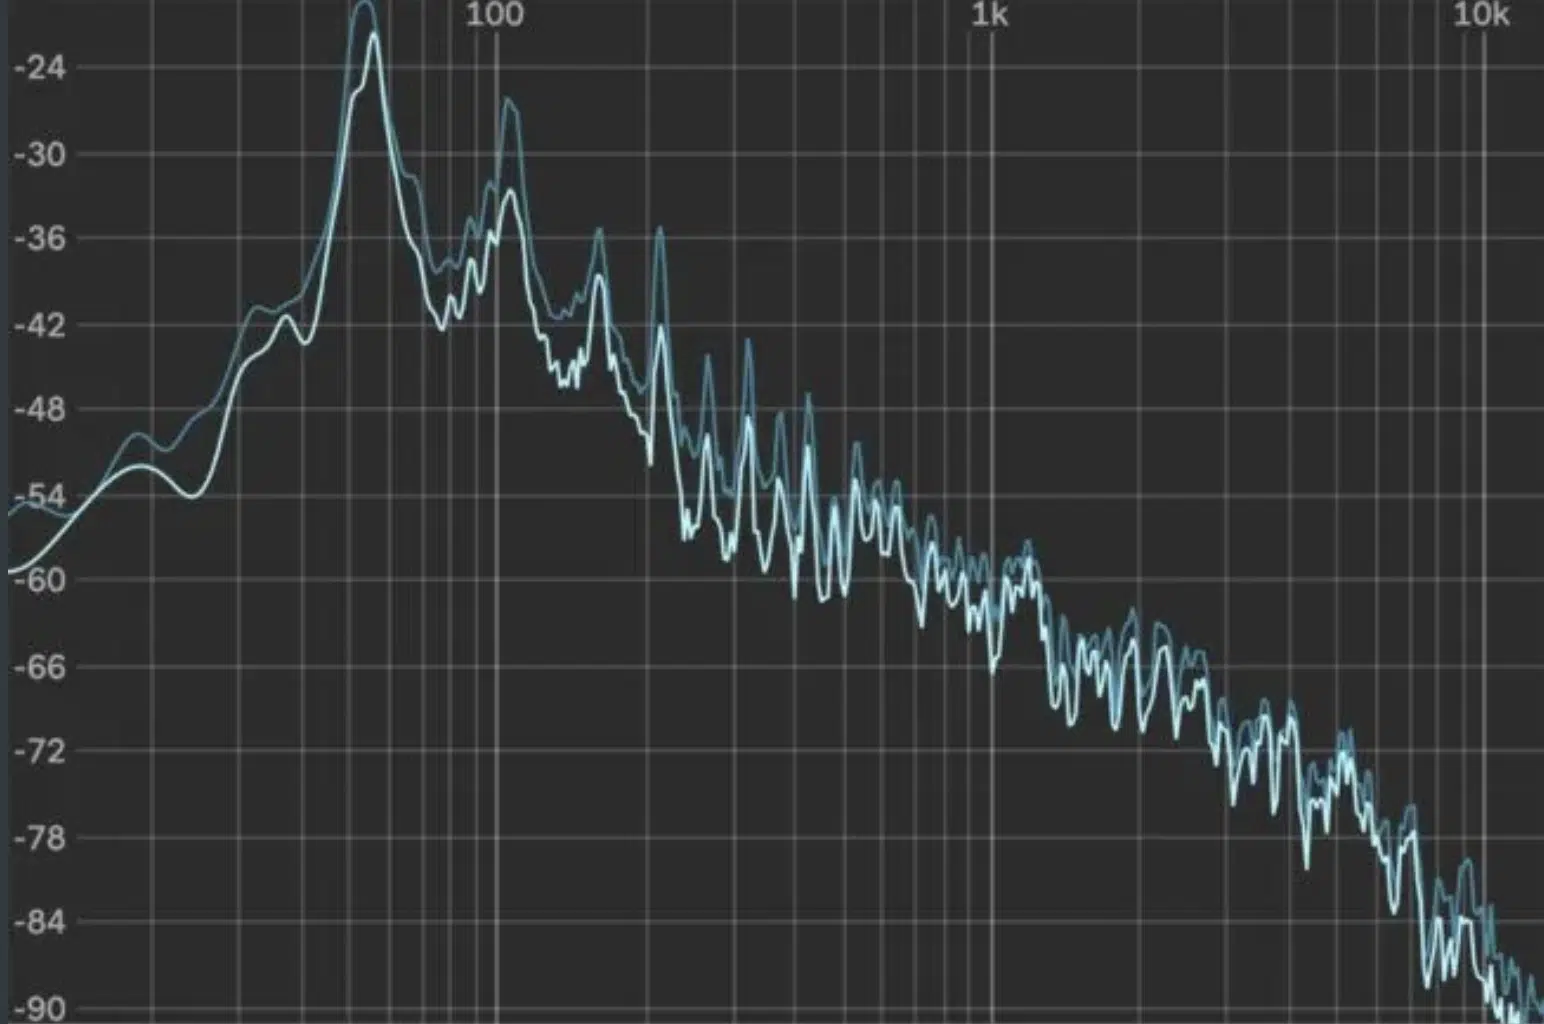
The frequency spectrum is the range of frequencies in all sound, from the lowest rumble at 20 Hz to the highest sparkle at 20 kHz.
Understanding how each unique range contributes to your mix is key to creating a balanced, professional sound, so let’s break it down real quick.
Sub-bass (20 Hz to 60 Hz) is where the deepest energy lives; think about the thump of a kick drum or the growl of a bass synth.
Keep an eye on this range using a spectrum analyzer, as excessive energy in your sub-bass section can eat up your dynamic range and muddy the mix.
For super clean sub-bass sounds, try using a gentle high-pass filter on non-bass instruments at around 40 Hz to avoid unnecessary rumble.
Bass (60 Hz to 250 Hz) gives the track its weight and groove 一 without this range, the mix would feel insanely hollow, as I’m sure you can imagine.
A peak at 120 Hz might indicate a kick that’s too boomy, while weak energy around 200 Hz could mean your bassline lacks punch.
You’re going to use your spectrum analyzer to identify dips and when you’re boosting or cutting, make sure it’s no more than 2–3 dB for subtle corrections.
The low-midrange (250 Hz to 500 Hz) adds warmth, but too much can make your mix muddy, so keep that in mind when using spectrum analyzers.
For example, if you see an excess of energy around 300 Hz on your analyzer, it might indicate a buildup in overlapping frequencies from guitars or synth pads.
My personal advice would be to sweep through this range with a narrow EQ band to pinpoint and cut problematic frequency components without dulling the sound.
The midrange (500 Hz to 2 kHz) is where vocals and leads often sit. This area requires precise attention during spectrum analysis to avoid harshness.
For example, if a vocal feels lost in the mix, check for gaps between 1 kHz and 1.5 kHz.
Boosting this range slightly can make vocals stand out, but again watch for spectral components that might clash with guitars or synths.
The upper midrange (2 kHz to 4 kHz) is critical for clarity and presence. This is where vocals “pop” in a mix but can also become super fatiguing if overdone.
If your analyzer shows spikes here, try a slight cut between 3 kHz and 3.5 kHz to tame harshness while keeping the track clear.
A spectrum analyzer/frequency range overlay can help you spot and address issues before they become overwhelming.
High frequencies (4 kHz to 20 kHz) add air and sparkle, but if there’s phase noise or excessive energy here, it can make the mix sound sharp.
You’re going to use tools like optical spectrum analyzers to identify whether high-end issues are caused by weak signals or actual recording artifacts.
For example, sibilance in vocals around 8 kHz might show up as a sharp peak, which can be corrected with a de-esser or EQ cut.
Bottom line, a good spectrum analyzer will help you make sure every frequency range is balanced, with no peaks or dips that disrupt the track’s frequency response.
Types of Spectrum Analyzers: Breaking it Down
There are several types of spectrum analyzers, each having a specific job to do. From real-time spectrum analyzers for live adjustments to RF spectrum analyzers for working with radio frequencies, each tool provides unique insights into your audio’s frequency domain. So, let’s get into it.
-
Real-Time Analyzers
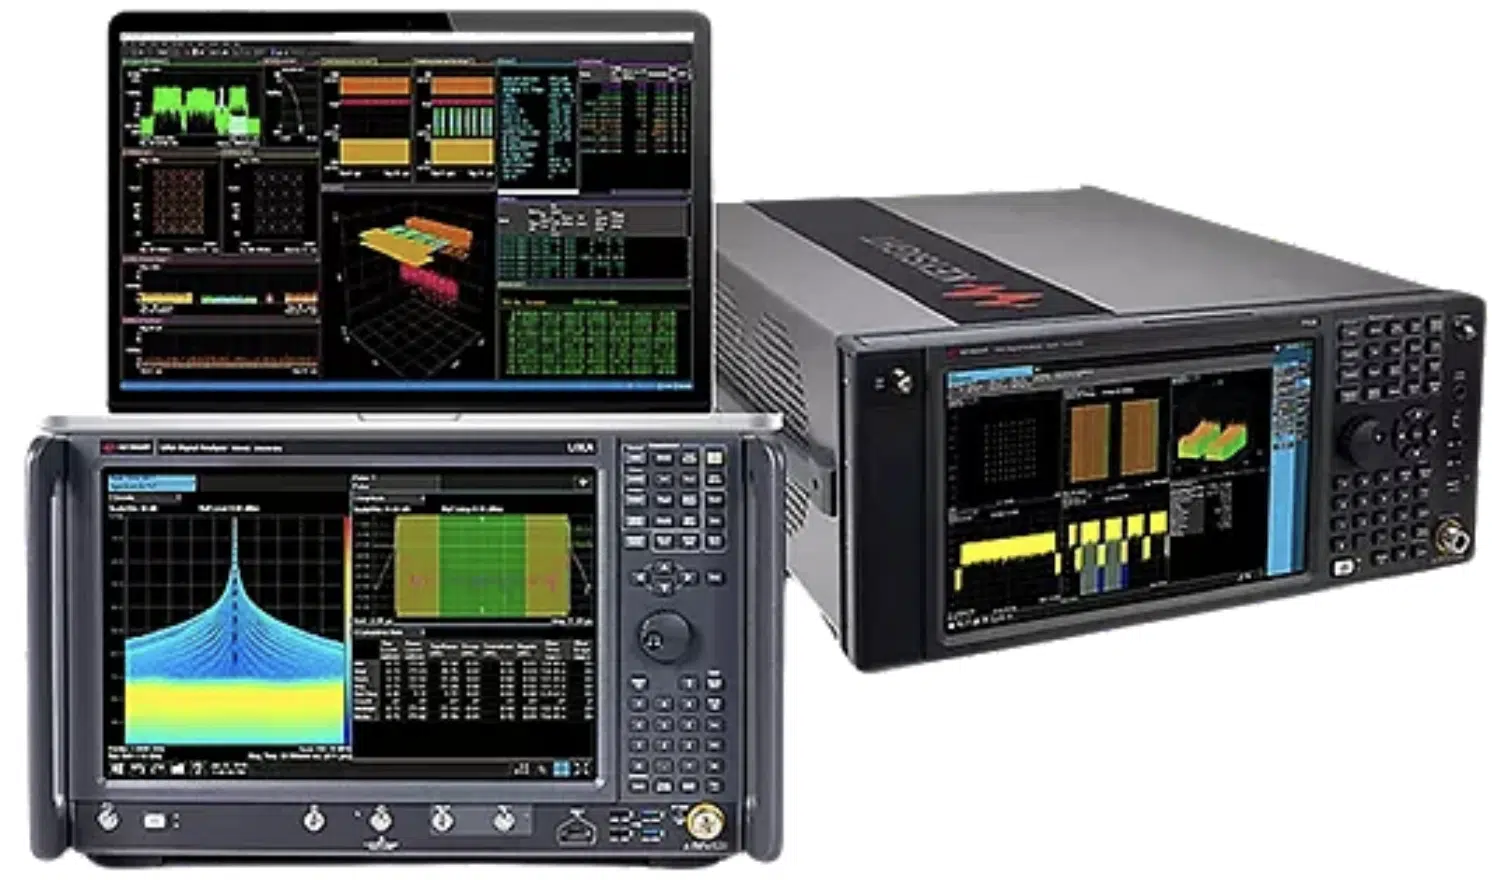
Real-time spectrum analyzers allow you to monitor audio or RF signals as they’re happening, giving you instant feedback on your frequency spectrum.
Whether you’re working in the studio or managing a live performance, this tool is essential for catching frequency imbalances in real-time.
They’re also perfect for live mixing, where you need to spot frequency issues without any delay because that could mess everything up.
For example, when fine-tuning a live vocal mix, you can use a vector signal analyzer to check for harsh frequencies in the 2 kHz to 4 kHz range.
RF spectrum analyzers are another subset of real-time tools that focus on analyzing radio frequency signals.
If you’re dealing with some wireless mic issues, this one’s perfect.
A real-time analyzer typically features adjustable parameters like resolution bandwidth, which lets you control how detailed the display is.
If you’re having problems with your low-end, set a wider bandwidth to view the full frequency range, or narrow it down to focus on problematic frequencies.
Many modern tools allow for spectrum monitoring over time 一 making it easier to identify patterns in frequency components.
For example, if a room has a persistent 60 Hz hum, you can reliably detect it and demolish it on sight.
By narrowing your focus to the input signals versus frequency, you can isolate and remove the unwanted noise with razor-sharp precision.
NOTE: Advanced units like handheld or standalone vector spectrum analyzers can even measure phase noise and other spectral anomalies.
By combining visual feedback with precise settings, real-time analyzers help you fine-tune your sound like a boss.
-
FFT (Fast Fourier Transform) Analyzers
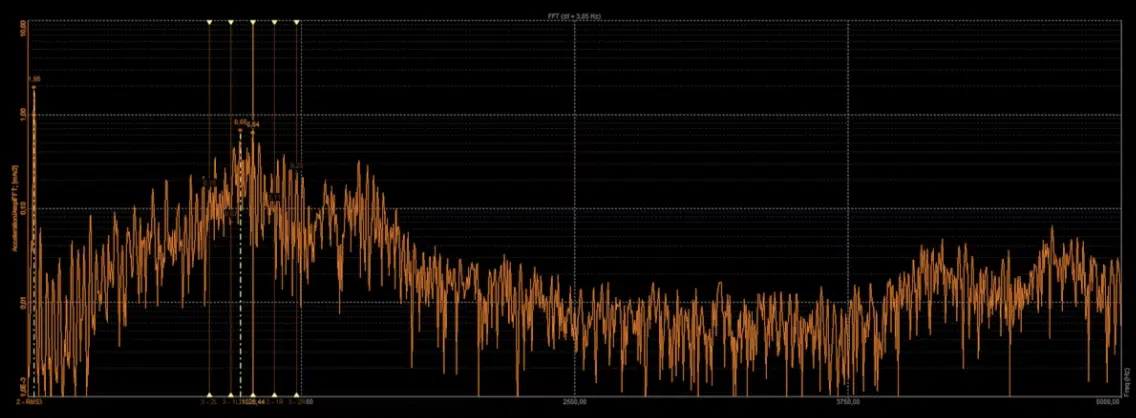
FFT analyzers (Fast Fourier Transform analyzers) are some of the most precise tools in the game for breaking down audio into its frequency components.
These spectrum analyzers use advanced DSP (Digital Signal Processing) to calculate and display the amplitude of individual frequencies almost instantly.
Side note digital signal processing (DSP) is all about taking audio signals and using technology to shape, enhance, or clean them up whether mixing vocals or mastering.
For example, when analyzing a kick drum, an FFT analyzer can show a clear peak around 50 Hz (sub-bass) and additional energy in the 100-200 Hz range.
This level of detail helps you isolate specific issues, like an overly resonant frequency or any harmonic distortion going on.
What makes FFT analyzers unique is their ability to focus on a specific frequency range.
Let’s say you’re mixing vocals and want to tame harshness in the upper mids because they’re giving you some serious problems…
With an FFT analyzer, you can zoom in on the 2 kHz to 4 kHz range to identify and reduce problematic spikes.
Adjusting the resolution bandwidth to a narrower setting gives you even more detail so you’ll be on point when it comes to your EQ adjustments.
FFT analyzers are also great for measuring phase noise and other subtle spectral details that may go unnoticed in any other situation.
Whether you’re tweaking a muddy mix or fine-tuning a bassline, this type of analyzer is a must-have if you really want to master spectrum analyzers as a whole.
Setting Up a Spectrum Analyzer in Your DAW Reading the Display
Adding a spectrum analyzer to your DAW workflow lets you see what your ears might miss by accident. Once you’ve inserted an analyzer on the signal path, understanding how to interpret its display is key to making the right adjustments. So, let’s dive in.
-
Frequency (Horizontal Axis)
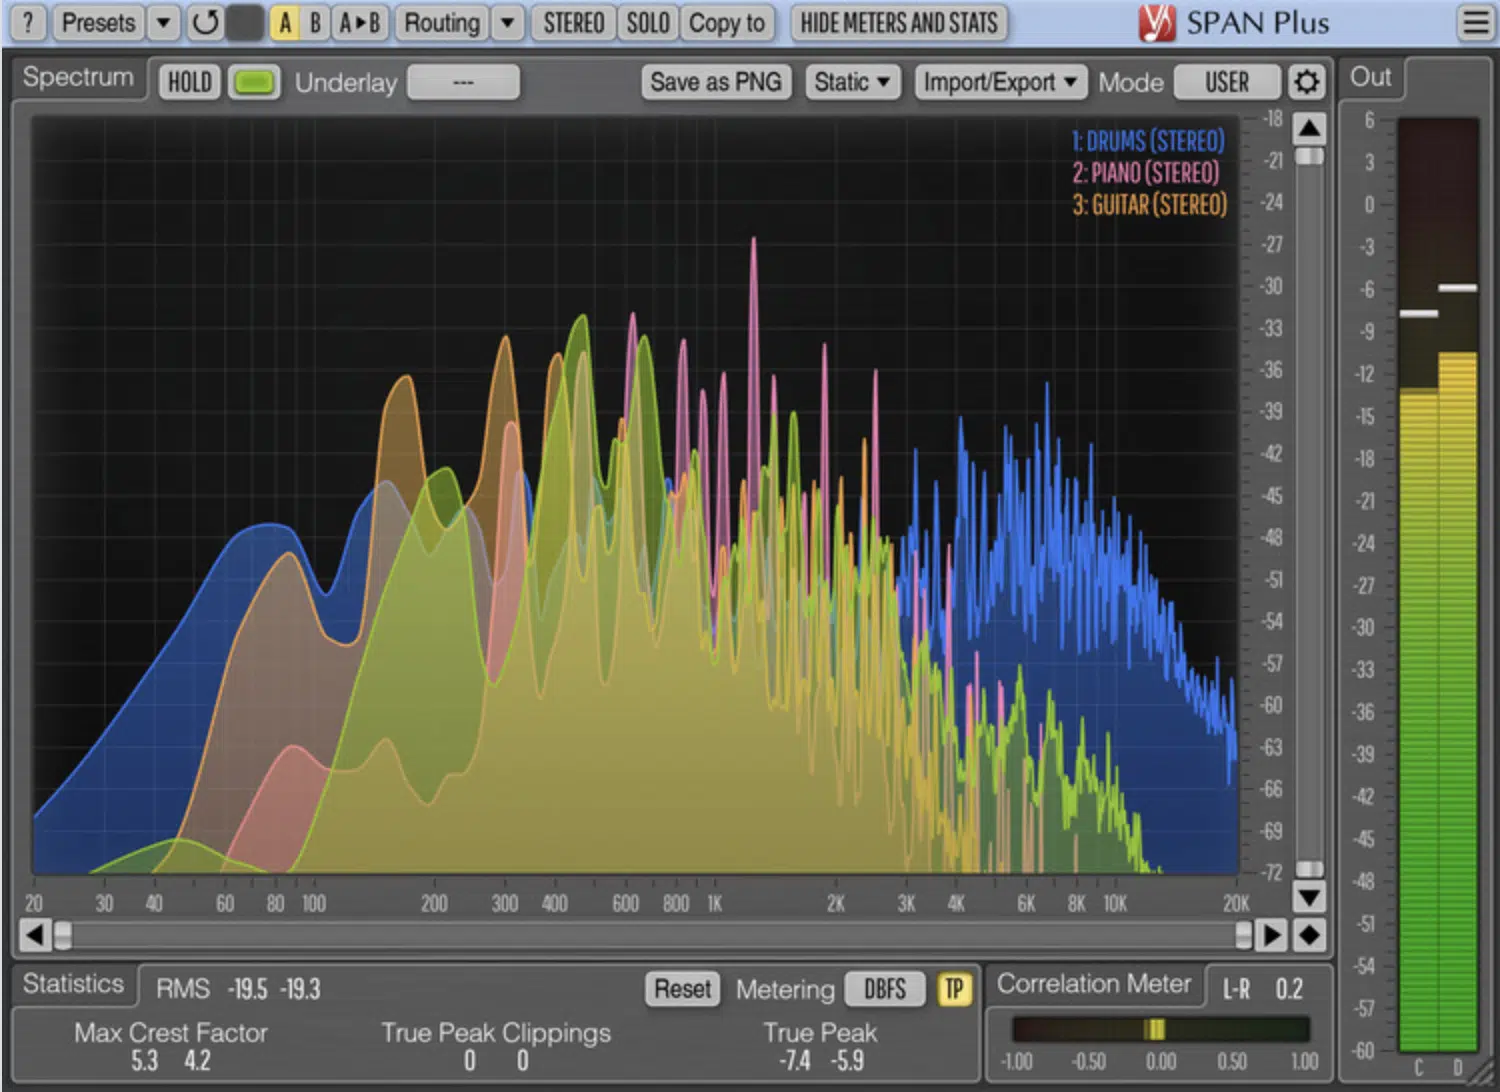
The horizontal axis on a spectrum display represents the frequency spectrum, typically ranging from 20 Hz to 20 kHz for audio signals.
This allows you to pinpoint specific frequencies and analyze how they’ll behave in your mix and see if anything needs to be fixed.
For example, if your kick drum sounds way too boomy, you might notice an excessive peak around 60 Hz.
On the flip side, if your vocal feels thin, you might see a lack of energy in the 500 Hz to 1 kHz range and want to get on that.
Most analyzers let you adjust the frequency span as well, which can help when working on a focused range like the bass or treble.
For instance, setting the span to 20 Hz – 200 Hz lets you clearly see how your sub-bass interacts with the bass frequencies.
A real-time spectrum analyzer updates this data right away, so you can monitor changes as you EQ, compress, or apply filters (super beneficial).
This is super helpful when you want to make sure the full frequency range is balanced, without excessive peaks or valleys.
-
Amplitude (Vertical Axis)
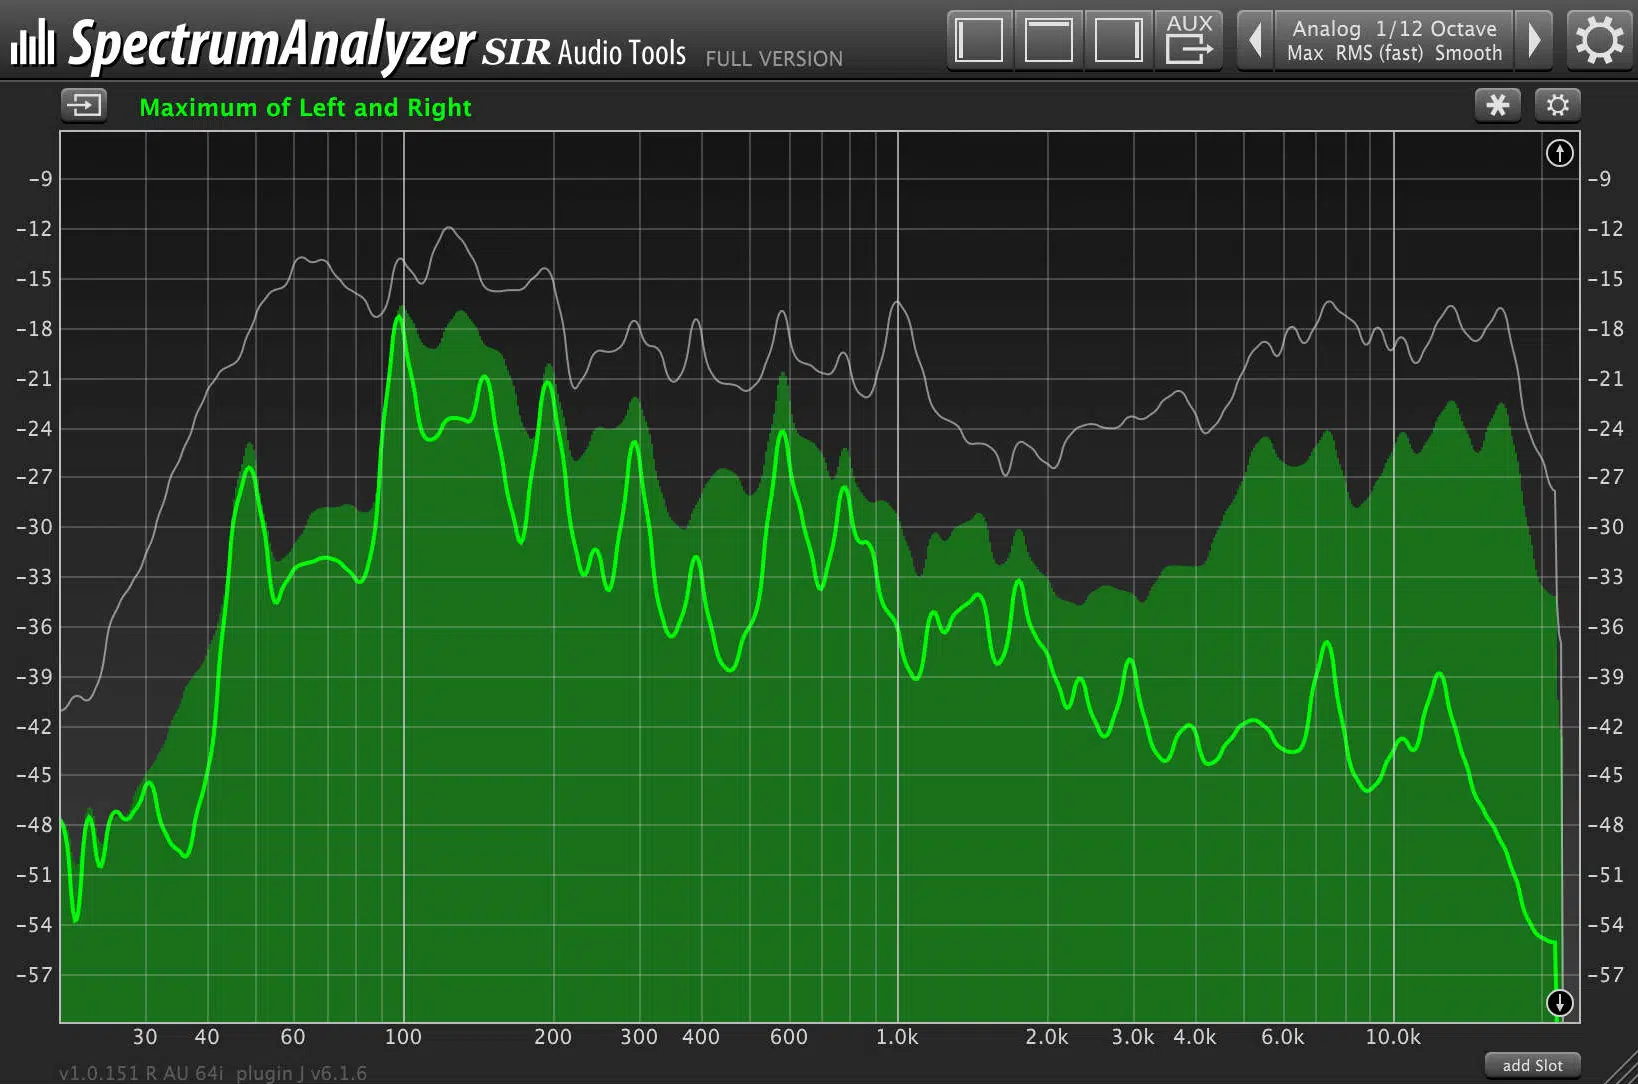
The vertical axis of a spectrum analyzer, on the other hand, shows the amplitude or loudness of each frequency, measured in decibels (dB).
This tells you exactly how prominent different parts of the frequency spectrum are in your mix.
If your snare drum feels buried and whack, the analyzer might show low amplitude around 2 kHz, where the snare’s snap usually lives.
To fix this, you can apply a boost of 2–3 dB in this range with an EQ, which will make the snare punchier without overpowering any other elements.
This quick visual feedback will help you dial in adjustments that really make a difference in the big picture and enhance your skills at the same time, so win-win.
Amplitude analysis also helps identify weak signals, which might be too low to hear clearly or even at all.
You’ll want to focus on frequencies below -40 dB to spot subtle details that might be adding noise or mud.
Resolution bandwidth adjustments can fine-tune the display 一 making it easier to measure small amplitude changes across specific frequency bands.
For example, if your spectrum analyzer shows a faint low-mid buildup around 350 Hz, it could be adding to an overall muddy sound, and nobody wants that.
Cutting this by 1–2 dB can improve clarity without killing any warmth.
By visually confirming amplitude balance, you’ll guarantee that no part of the mix is overpowering or totally weak.
For example, if you’re working on a bass-heavy track, the analyzer can help you avoid overwhelming the sub-bass range.
But, at the same time, maintaining punch and definition in the 60–120 Hz range.
When used with your ears, this process leads to the most accurate measurements ever and a more polished mix overall.
-
Time Resolution and Averaging
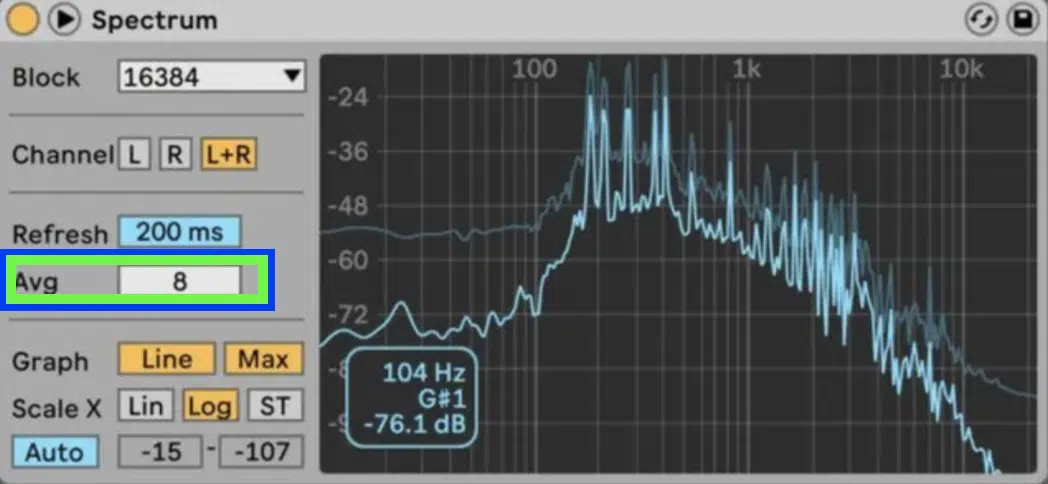
Time resolution refers to how quickly the spectrum analyzer updates its display, which directly impacts how accurately you can track changes in real-time audio or RF signals.
For example, if you’re analyzing a transient-heavy input signal like a snare hit, a higher time resolution captures those quick spikes.
It shows the particular frequency components as they occur, but this can make the display feel jittery or overwhelming, so keep that in mind.
By using averaging, you can smooth out the spectrum display, which is great for checking out sustained sounds like vocals or pads.
A good starting point for time resolution is around 50 milliseconds for transient-heavy material and 200 milliseconds for sustained audio.
If your spectrum analyzer offers real-time averaging, enable it to get a stable view of your frequency spectrum without losing too much detail.
For instance, when working with vocals, averaging will make sure you don’t get distracted by minor, fleeting peaks 一 helping you focus on the broader frequency range.
Using tools like FFT analyzers, you can combine these settings to tweak/manipulate the analysis to the type of input signal you’re working with.
The balance between time resolution and averaging is key for ensuring both precision and readability which is perfect.
-
Adjusting Slope/Tilt Settings
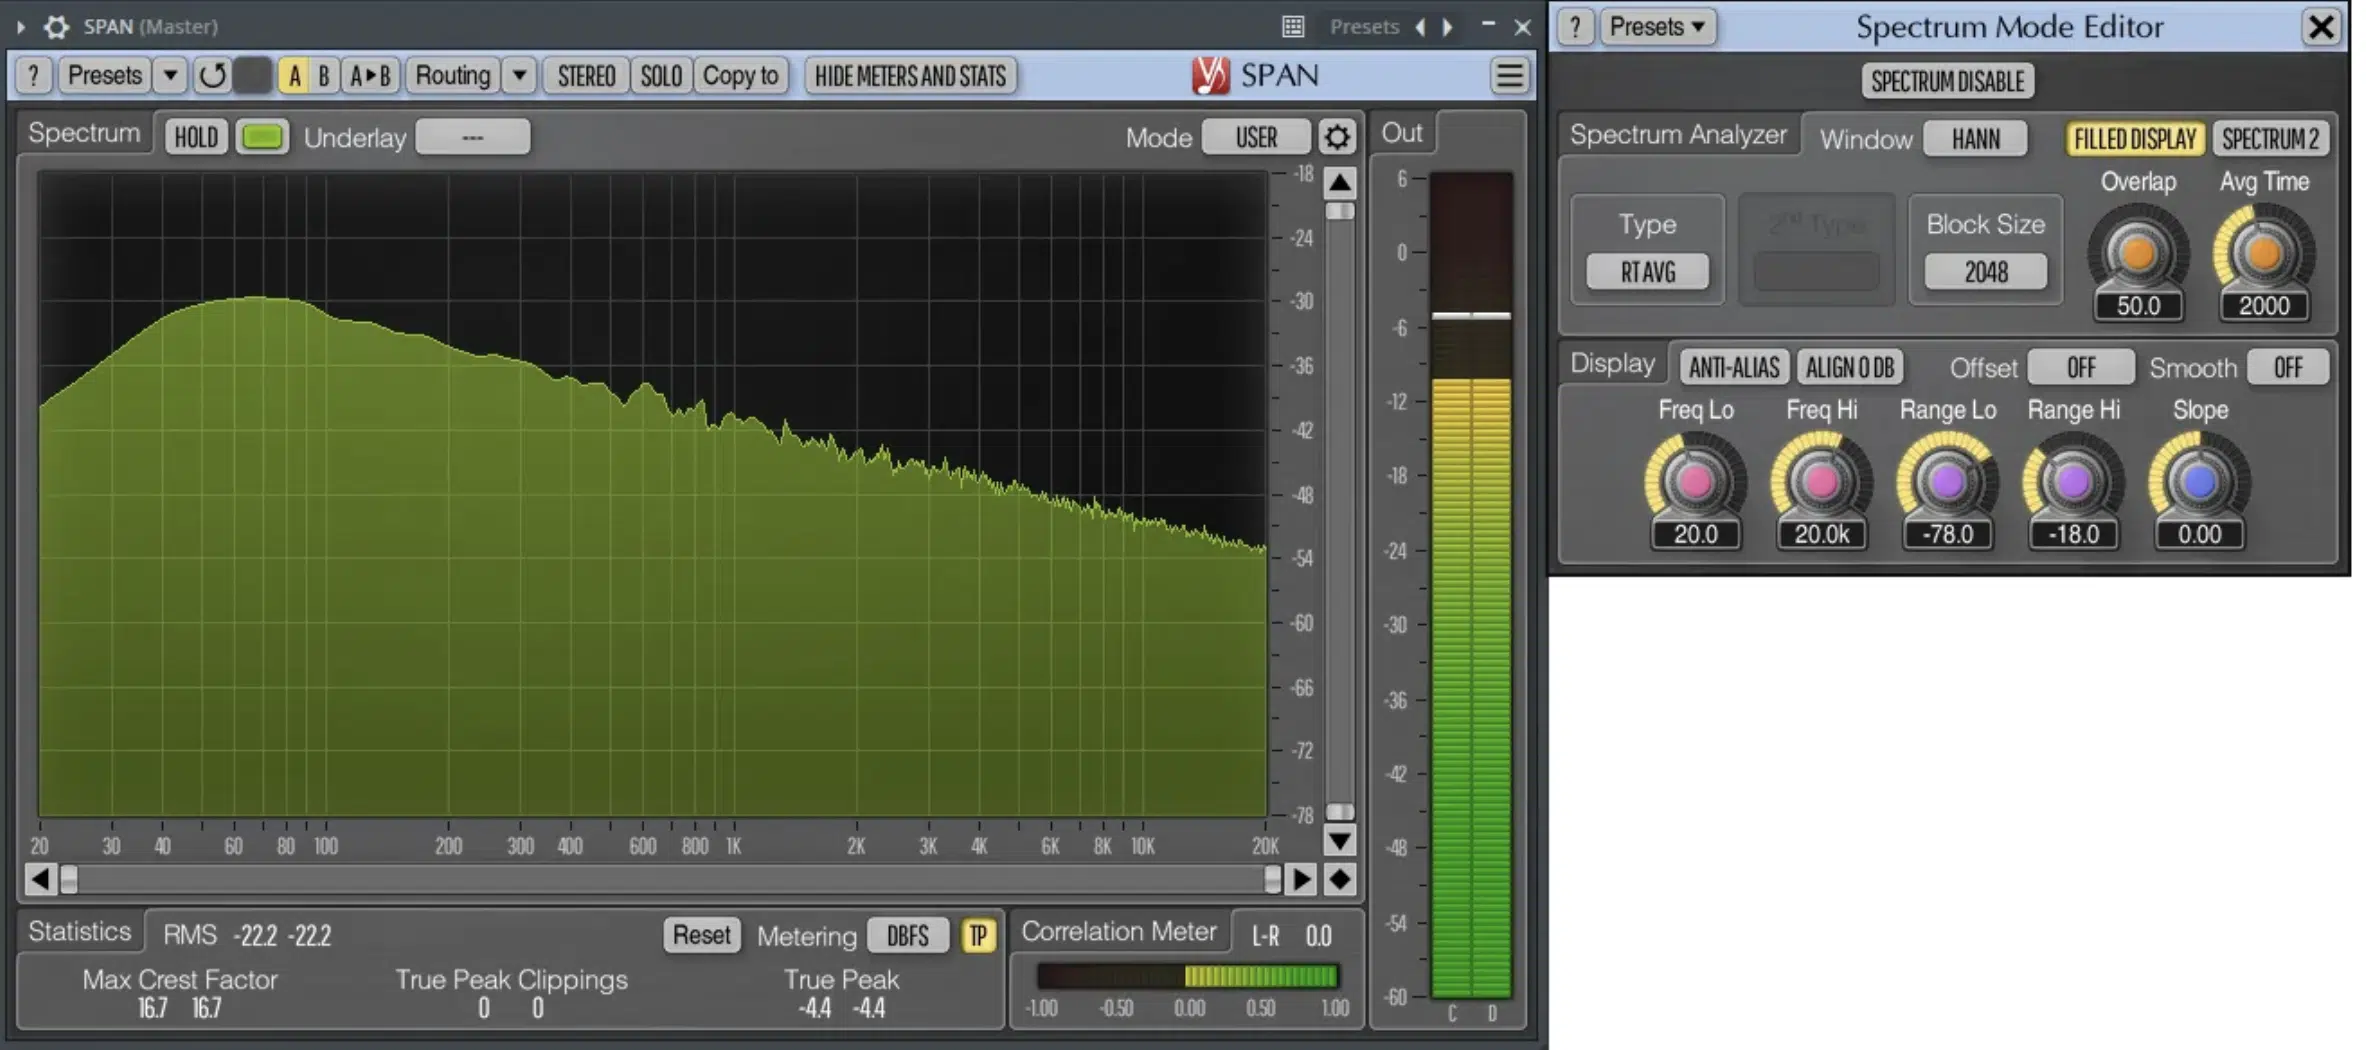
Slope or tilt settings adjust how the frequency spectrum is visualized, helping you compensate for the natural roll-off in the high frequencies of most signals.
By default, many spectrum analyzers use a slope of 3 dB per octave, which mimics how human ears perceive sound.
For example, if you’re analyzing a mix and notice the highs appear quiet, adjusting the slope can give you a more accurate representation of how the mix actually sounds.
If you’re balancing low-end elements like kick drums and bass, a flatter slope (e.g., 0 dB per octave) can help you see if there’s mad energy in the sub-bass range below 60 Hz.
On the other hand, when fine-tuning vocals or high-end percussion, a steeper slope (e.g., 6 dB per octave) can emphasize those frequencies.
This makes it easier to spot deficiencies around 10 kHz.
Most modern spectrum analyzers allow you to adjust this parameter with a simple slider or dropdown menu (very simple and straightforward).
Playing around with slopes during spectrum analysis is a pro move that handles what actually matters in your mix, rather than chasing inaccurate visual data.
And, let’s be honest, nobody has time for that.
-
Setting Resolution and Refresh Rates
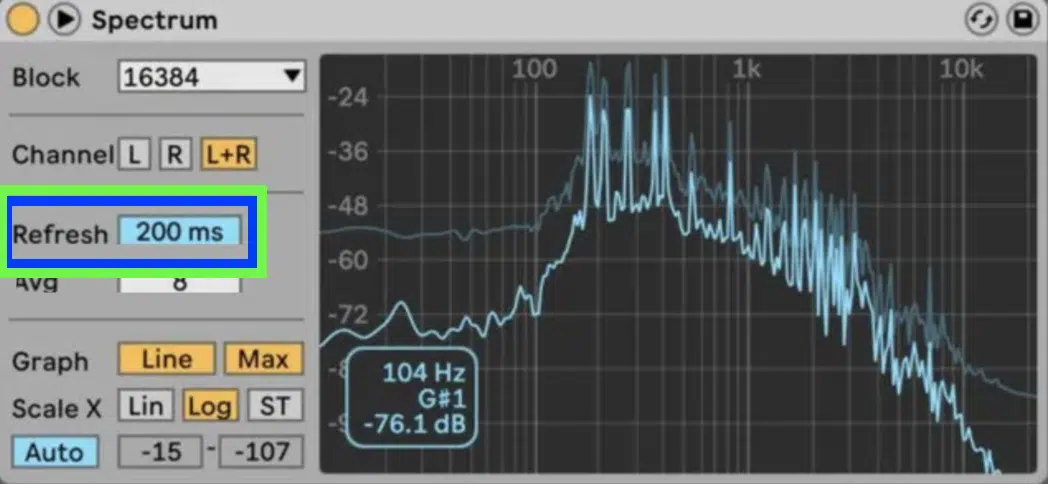
Resolution determines how finely your spectrum analyzer divides the frequency spectrum, while refresh rate dictates how often the display updates.
A higher resolution, such as 4096 points (common in FFT analyzers), provides super detailed insight into individual frequency components.
This is perfect for spotting narrow resonances, like a ringing at 800 Hz caused by a snare drum.
However, higher resolutions require a longer processing time, which can put off updates and make the display feel sluggish, so keep that in mind.
When working on general/broad tasks like balancing a mix, a resolution of 1024 or 2048 points strikes a good balance between detail and speed.
Refresh rates also play a key role:
- A faster rate, such as 60 updates per second, is ideal for real-time monitoring.
- A slower rate, like 30 updates per second, helps when analyzing static material like a mastered track.
For input signal analysis involving low-end frequencies, ensure the analyzer’s resolution bandwidth is set narrow enough to distinguish between overlapping bass notes.
Fine-tuning these settings makes sure your analyzer will give you data that’s always on point, clear, concise, precise, and easy to break down.
-
Identifying Frequency Buildups
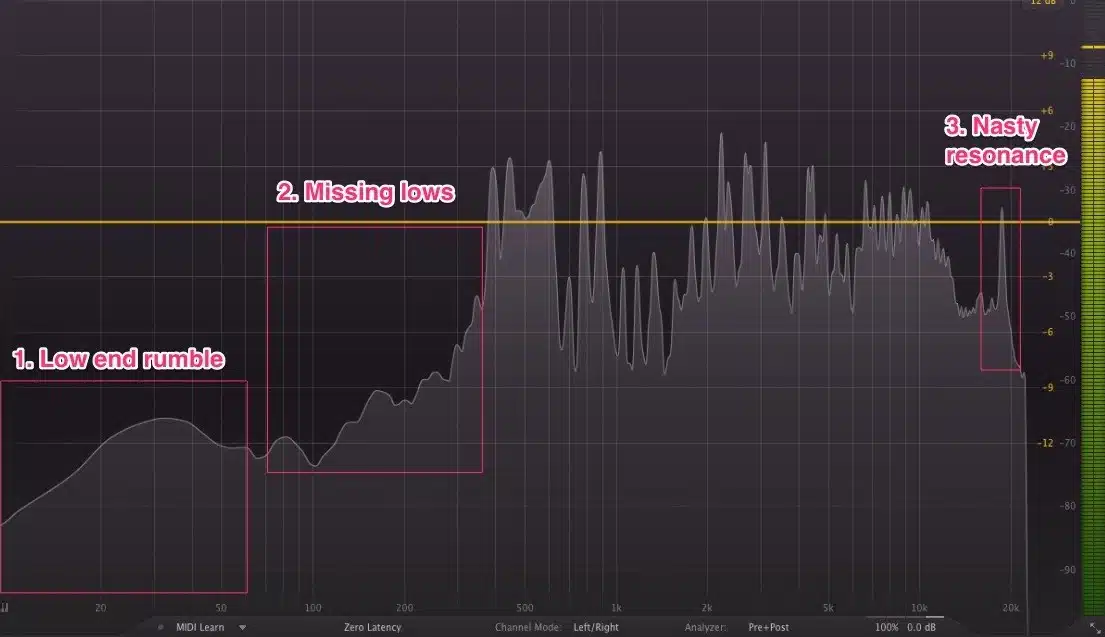
Frequency buildups happen when specific frequencies stack up too heavily and create a super sloppy, unbalanced, and muddy mix.
These buildups typically happen in the low-midrange (250 Hz to 500 Hz), where warmth can quickly turn into mud if a wide range of elements overlap.
For example, if your guitars, vocals, and snare drum all dominate the 400 Hz range, you’ll see a noticeable peak on the spectrum display.
To address this, you’ll use (you guessed it) a spectrum analyzer to pinpoint the particular frequency point where the buildup occurs.
A common trick is to solo each track and watch how its frequency spectrum behaves.
Let’s say the vocal is overpowered around 300 Hz 一 a subtle EQ cut of 3-4 dB at that frequency can make proper space for all your other elements.
When working with sub-bass, buildups below 60 Hz can drown out your kick drum, so using a high-pass filter on non-essential tracks like pads or effects can help.
NOTE: Look out for overlapping frequency bands, especially when layering sounds like synths and strings.
If your analyzer includes a heatmap or 3D spectrogram, use it to track changes in amplitude over time, helping you isolate buildup during dynamic sections.
By methodically addressing these issues, you can achieve a balanced mix that translates well across different playback systems.
Pro Tip
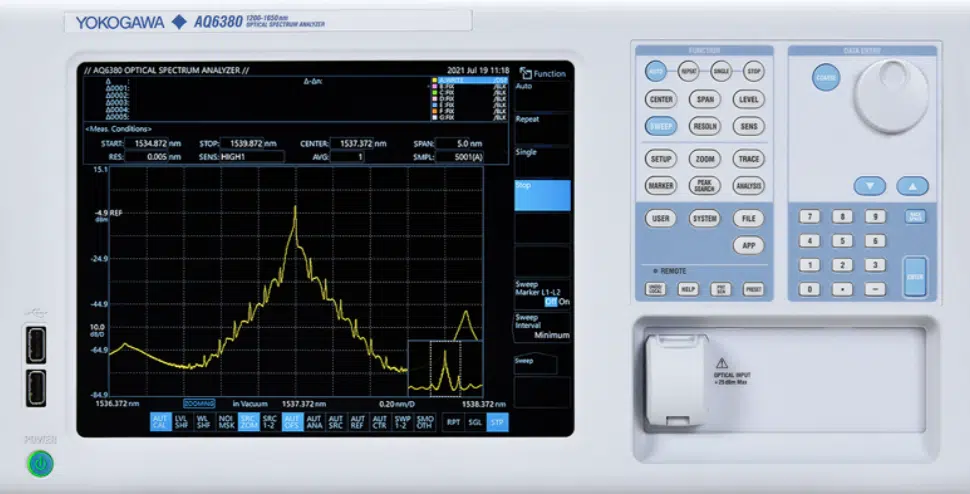
When using spectrum analyzers, pay attention to how the spectrum analyzer measures energy distribution across the frequency range.
A swept-tuned spectrum analyzer is especially useful for detailed comparisons of input signals versus frequency because it allows for precise isolation of spectral components that might be causing issues.
For advanced processes, try out optical spectrum analyzers when working with audio systems that incorporate light-based processing.
Whether dealing with known and unknown signals, understanding how they move in the spectrum analyzer/frequency range can help you pinpoint and resolve buildups.
Monitoring Dynamic Range
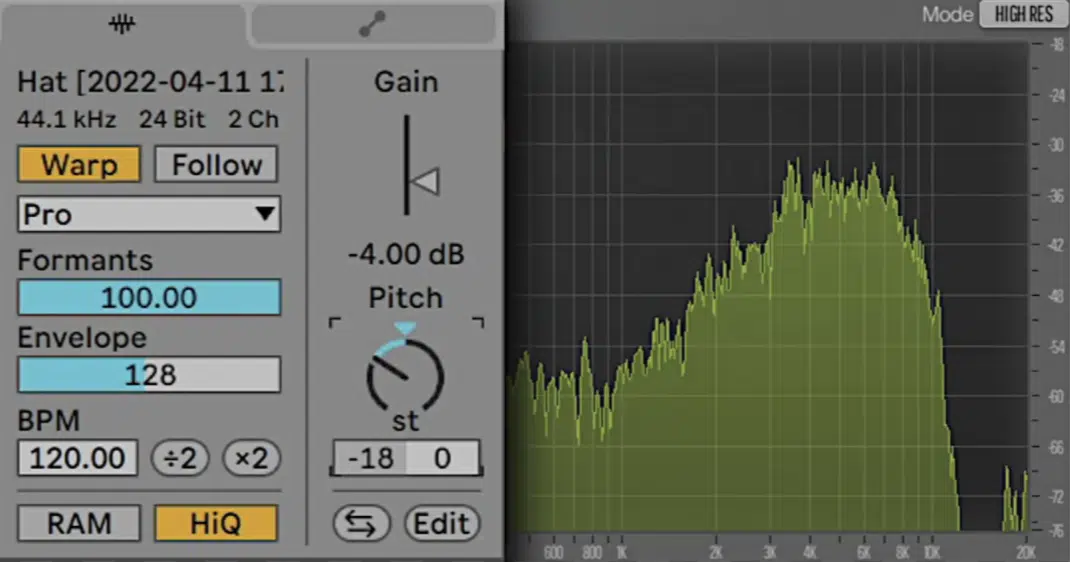
Dynamic range refers to the difference between the softest and loudest parts of your track, and it’s key for creating an engaging, professional mix.
A spectrum analyzer can help you spot areas where your dynamics might be too restricted or, on the flip side, too wide.
For example, if your kick and bass consistently show peaks at -3 dB but your higher frequencies sit far lower, your mix might lack energy and presence.
We talked about that earlier, so it should be getting easier now.
Use a real-time spectrum analyzer or an FFT analyzer to monitor how your dynamics shift across the frequency spectrum.
For EDM tracks, a signal-to-noise ratio of at least 6 dB ensures punch without sacrificing clarity, because you definitely don’t want to do that.
If your track feels too compressed, reducing the ratio on your master bus compressor can restore some natural movement.
When troubleshooting weak dynamics in the low end, try layering a clean sub with a slightly distorted bass to fill out the frequency range and enhance impact.
NOTE: Regularly check the displayed average noise level and make sure no single element is overly dominating the mix, which can lead to a lack of balance.
Phase and Stereo Imaging
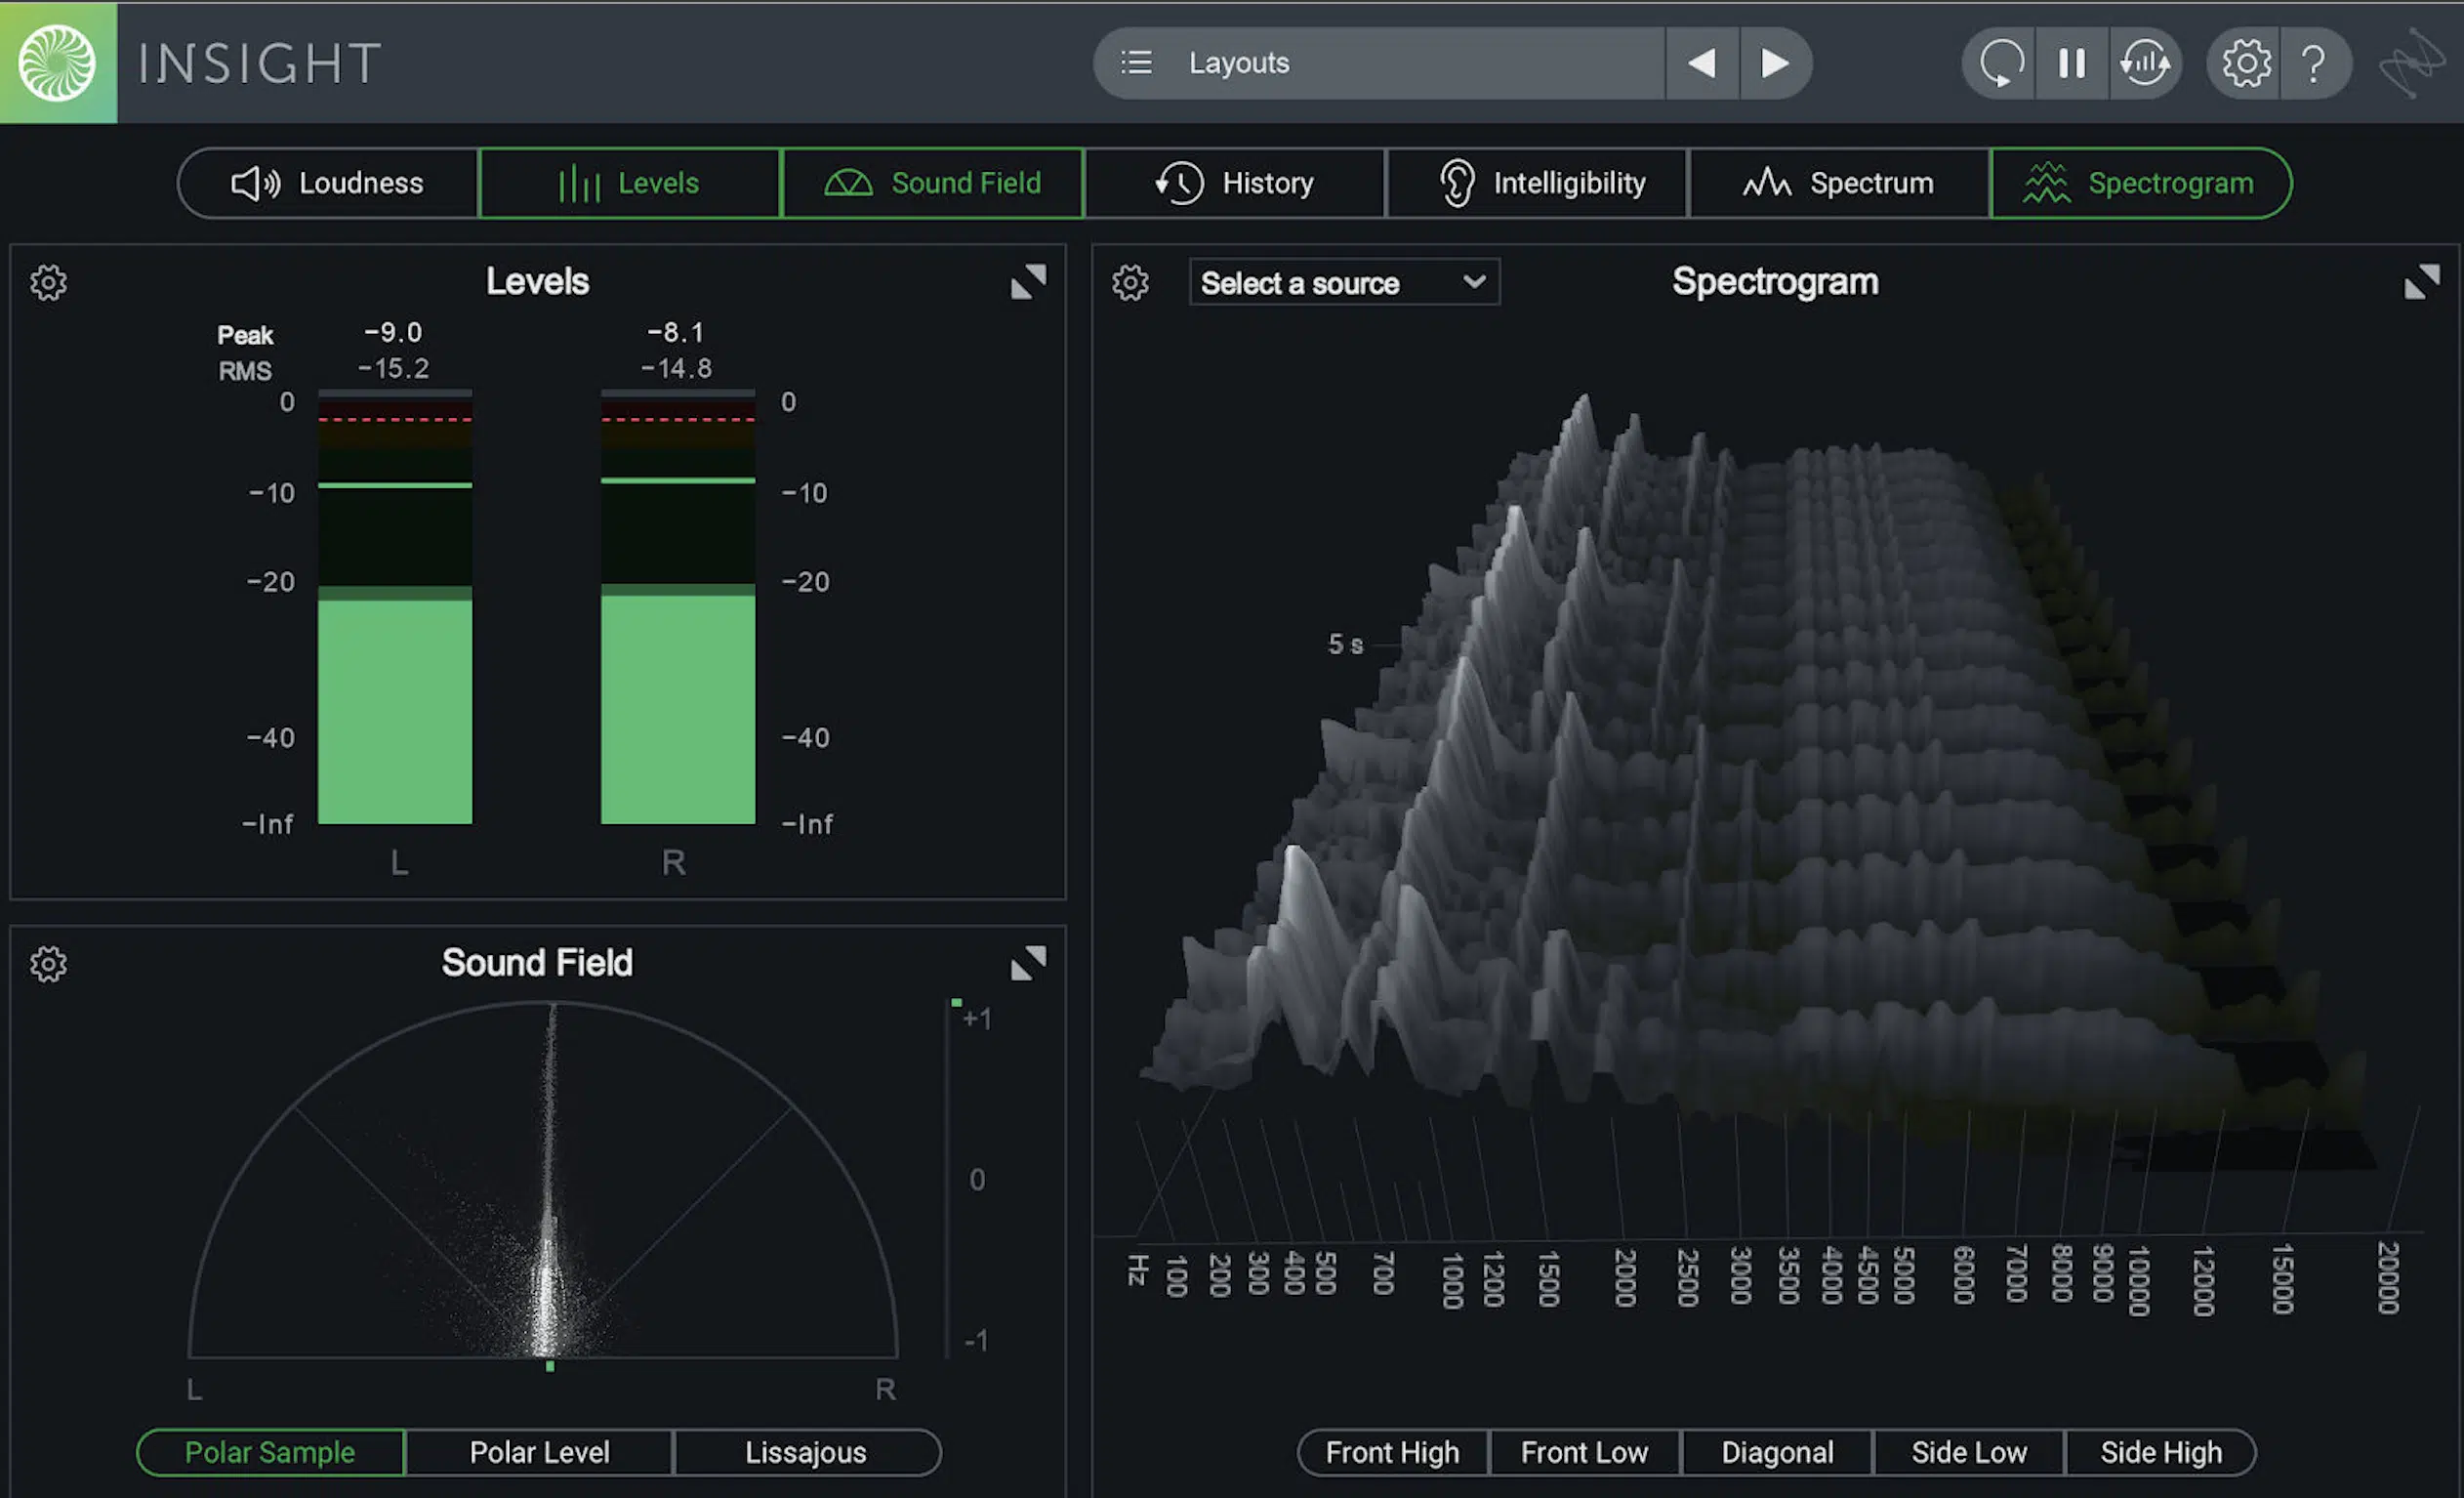
Phase and stereo imaging play a huge role in how wide and clear your mix sounds.
Spectrum analyzers equipped with phase correlation meters help you detect phase issues, such as a bass line that’s out of phase with the kick.
This can lead to frequency cancellations all day, so be careful.
For example, if your kick feels thin, checking the phase noise at low frequencies (20-80 Hz) can reveal destructive interference.
Adjusting the phase alignment in your DAW (digital audio workstation) or using a phase correction plugin can solve this.
Stereo imaging is also essential, so analyze how your mix spreads across the stereo field by watching the balance of the left and right channels.
If your track feels too narrow, try using a mid/side EQ to boost the high frequencies in the side channel 一 adding width to cymbals or pads.
Conversely, if elements like vocals or bass feel too wide, focus on centering them in the mix.
Phase information and stereo spread work hand-in-hand to create a professional soundstage so every element is clearly defined and in its proper place.
The ultimate example of teamwork makes the dream work if you ask me.
Bonus: Advanced Techniques for Using Spectrum Analyzers
Once you’ve got the basics locked down, you can try out some more advanced uses of spectrum analyzing. From mid/side analysis to multi-channel monitoring, these techniques can help you unlock a new level of skill when it comes to refining your sound.
-
Mid/Side Spectrum Analysis
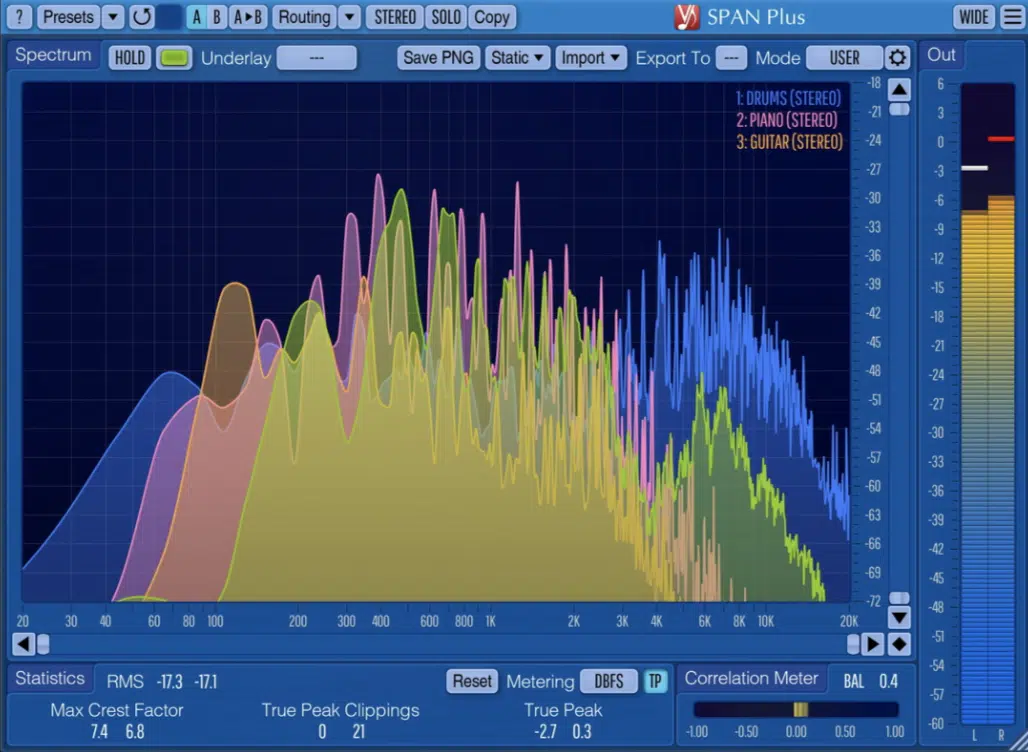
Mid/side spectrum analysis lets you focus on the balance between your mix’s mono (mid) and stereo (side) elements for ultimate clarity and width.
For example, if your bassline is muddy, a spectrum analyzer can show overlapping energy in the mid-channel below 100 Hz, where the kick and bass might be competing.
By EQing the mids to carve out space for the kick at 60 Hz, while slightly boosting the bass side content around 80 Hz, you can achieve ideal separation.
Or, you might notice your synth pads have excessive stereo energy above 10 kHz, which can make the mix feel unbalanced.
By using a vector signal analyzer, you can easily isolate these side frequencies and dial them back (by 2-3dB) to match the tonal balance of the mid-channel.
This technique also works when mastering…
Applying subtle EQ boosts in the side channel between 12 kHz and 16 kHz can enhance width while maintaining mono compatibility.
Mid/side spectrum analysis is also invaluable when it comes to achieving the ideal dynamic range balance.
For example, if your side channel has excessive low-end energy, such as reverb tails below 120 Hz, cutting those frequencies ensures your mix stays tight and punchy.
Enhancing side frequencies, on the other hand, like between 2 kHz and 5 kHz can add brilliance and definition to your mix without interfering with the mono foundation.
Overall, it’s super helpful and can make your tracks clean from headphones to club speakers.
-
Multi-Channel Analysis
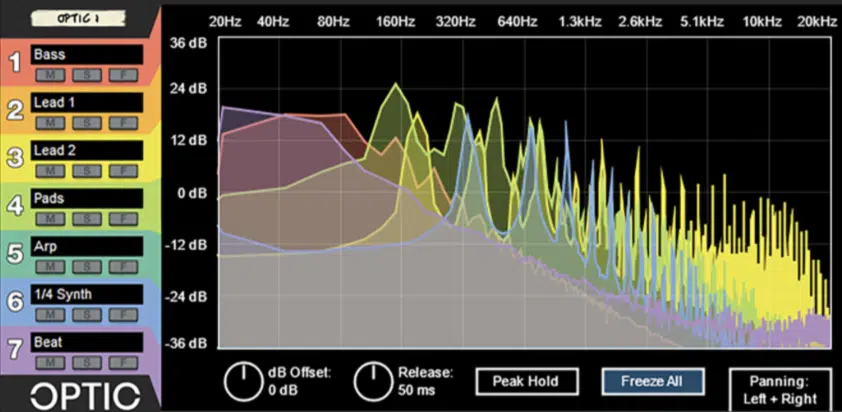
Multi-channel analysis is also invaluable for monitoring the relationship between different elements in your mix, such as kick, bass, and vocals.
If you notice a persistent peak at 150 Hz in both your drum bus and bass bus, this suggests masking.
To then fix this problem, you only have to reduce the single frequency in one channel.
Many real-time spectrum analyzers (such as those with multi-channel capabilities), allow you to overlay tracks on a single display for a clearer comparison.
When working with frequency components in complex mixes, adjusting the analyzer’s resolution bandwidth to at least 1024 points helps you distinguish subtle overlaps.
For stereo mixes, make sure that left and right channels are balanced by checking for symmetry in the frequency spectrum, especially in the low end.
This is extremely important in bass-heavy genres like trap or EDM, where uneven low-end energy can make the mix sound lopsided and amateur as hell.
Multi-channel monitoring tools also help you detect phase cancellation issues, which can occur if multiple tracks occupy the same frequency range but are out of phase.
-
3D Spectrograms
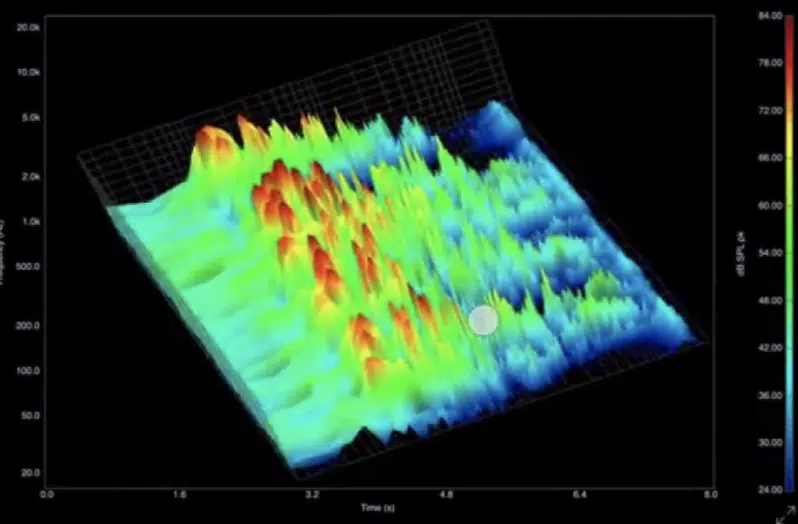
A 3D spectrogram is a little intense, but if you go for it, you should go big, am I right?
It gives you a super detailed look at how frequencies evolve over time so you can see everything from tonal balance to dynamics and everything in between.
It’s like having an X-ray for your frequencies pretty much.
For example, you can visually track how a reverb tail decays in the frequency domain, identifying areas where it might muddy up your mix.
If the tail creates unwanted energy buildup between 200 Hz and 400 Hz, you can use precise EQ cuts to clean it up while keeping that necessary (natural) decay.
These spectrograms are super helpful (especially in dense arrangements) for spotting:
- Phase noise
- Interference sources
- Overlapping frequency components
Imagine you’re working on a track with a dense low end, and the spectrogram reveals overlapping frequencies around 50 Hz between your sub-bass and kick drum…
You can simply adjust the sub-bass decay or sidechain it to the kick can help clean up this frequency clash so both elements retain their power/definition.
Adjusting the resolution of the spectrogram allows you to focus on specific frequency bands, like isolating low-end buildup below 60 Hz.
Using this tool to analyze spectral changes across a track’s length can help you balance elements like energy build-ups in a drop or breakdown.
You might find an unwanted spike around 2.5 kHz caused by a riser and can implement a quick EQ tweak or volume automation to make things much smoother.
Mixing a 3D spectrogram with traditional analysis ensures no detail is overlooked, so make sure to use your ears… I can’t emphasize it enough.
Final Thoughts
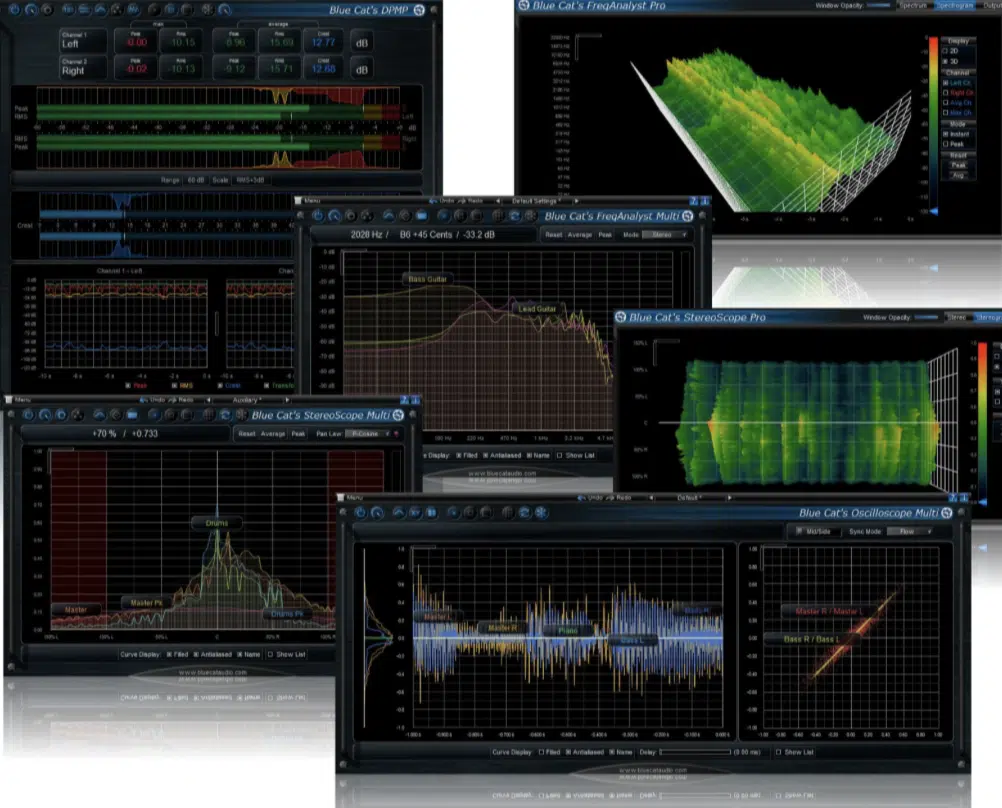
Spectrum analyzers, as you now know, are all about giving you a clear picture of your sound.
They let you identify frequency imbalances, optimize dynamic range, and shape your mix with precision.
Plus, they empower you to tackle everything from phase issues to tonal balance adjustments with confidence.
And now, using the tips, tricks, and techniques we’ve covered, you’ll be able to handle spectrum analyzers like a pro in no time.
And, as a special bonus, we’re giving you access to the absolute best, most legendary Free Sample Packs in the game.
You’ll get 100% free, royalty-free packs across all genres and styles (e.g., trap, hip-hop, pop, reggaeton, EDM, and more).
These insanely popular packs were created by world-class producers and sound designers, so you’ll be getting incredible value at zero cost.
Whether you’re looking for earth-shaking basslines, unforgettable melodies, or full project files, you’ll find it all here 一 trust me, you don’t want to miss.
Bottom line, with your new knowledge of spectrum analyzers, you can now fine-tune your mixes to perfection with precision and creativity.
Just remember, mastering this skill isn’t just about the visuals, so trust your ears, refine your craft, and watch your tracks reach the next level.
Until next time…


Leave a Reply
You must belogged in to post a comment.